3rd June 2025
Markets have been a fertile hunting ground for the active investor lately. Over the past five years, a huge influx of money has poured into index tracking funds as markets pushed higher and higher, and active managers were perhaps not seen to be adding value for their services. With low bond yields there was not much else investors needed to do except “buy the index”. But now we are in the era of erratic volatility, active investors can finally hone their crafts. While volatility is uncomfortable, it is a fundamental ingredient for active strategies and opens up opportunities for value creation.
Investors love to talk about talking about something, and these past months the question on investors’ minds was whether the US Dollar will remain as the global reserve currency.
The US Dollar has weakened this year, declining by nearly 9% (represented by the US Dollar Index), but this was Trump’s intention to boost US exports. Ten year treasury yields have also risen (as investors sold the bonds, pushing the prices down) on debt sustainability concerns.
It is certainly plausible that global Central Banks will find alternatives to diversify their reserves, but the simple fact is that there is no market big enough or liquid enough to support the volumes concerned. The US Treasury market is around $28 trillion in size, with over $900 billion traded daily. The UK Gilt market in comparison is $3.52 trillion.
This month Moody’s, the last of the big three credit rating agencies downgraded the US government from the highest Aaa credit rating to Aa1, the next rung down.
Treasury markets did not move too much on this news as S&P and Fitch had made the downgrade in 2011 and 2023 respectively. After all, credit ratings are an indication to gauge how likely it is you will be repaid by the borrower, and in that respect the debate on whether the US will default has not changed (ignoring some extremely left-field US policies which have been chucked about behind the scenes). It does highlight the concern over the sustainability of the US’ growing debt burden, with the interest payments alone forecast to account for over 3% of GDP.
While not restricted to the US, global long term yields, particularly the 10, 20 and 30 years have risen considerably this month. This yield curve steepening is caused by a myriad of problems, but put simply, investors don’t see the need to take on the risk with longer-dated debt when short-dated debt and cash is paying relatively handsomely.
Trump’s economic policies are intended to be pro-growth and whittle down the debt burden, with treasury yields increasing and growth forecast to slow, we will likely see real yields higher than real growth and further concern over fiscal stability, leading to a further steepening in the yield curve.
Trouble could be on the horizon for big tech and AI, with companies such as Meta and OpenAI reportedly struggling to improve their most advanced AI models, leading to questions as to whether the next stage of AI growth could be much slower.
Combined with the DeepSeek announcement earlier in the year, this does make investors nervous given how big tech valuations have improved over the past month. The main signal to watch out for is any indication that these companies are reducing their capital expenditure plans. This year Meta plans to spend $72 billion in capital expenditures, bigger than most companies’ actual market caps.
Inflation picked up in the UK in April, with core inflation, services inflation and wage growth above expectations and remaining strong. Markets now expect just one more interest rate cut this year from the Bank of England. Despite this UK equities have been ticking along nicely, posting solid gains for the year so far.
Global gold prices have continued to rise as traders and investors continue to park their capital in the precious metal amid uncertainty. When the dust settles we should see gold prices fall, as investors move their capital back into risky assets. We may see prices sticking at a higher level as Central Banks hold more gold to diversify from the US Dollar. Estimates by Goldman Sachs are for gold to top $3,700 per troy ounce by the end of 2025 (present COMEX Gold price is $3,354 as at 2nd June), although this is far from guaranteed.
And in other news, losses for investors in a cow bond scheme (owning cows that would be reared and sold for profit) in Uruguay have amounted to at least $350 million, as the cows they supposedly purchased for investment returns do not exist. Estimates of the number of these so called ‘phantom’ cows could be beyond 700,000, with investors actually travelling to the region in an attempt to locate their cows. This is growing to be one of the biggest financial scandals in the country.
–
Areas of focus
- High yield bond spreads have tightened again since spiking on April 7th.
- Long term global government debt has come under some pressure, with yields moving higher and yield curves steepening.
- Private equity firms have pushed for more access to retail investors, but with deal flows slowing deploying this capital will be more difficult.
- Despite the market for larger IPOs in the US drying up, the volume for smaller company listings on the NASDAQ is still hot.
- Luxury goods companies have faced slowing earnings, with those who raised their prices higher during the Covid era facing more difficulty in growing sales.
- Chinese technology company valuations have struggled recently, with Alibaba announcing slower than expected earnings. The steam from the DeepSeek announcement has faded, although the Hang Seng index has outperformed the mainland Chinese indices YTD.
–
Asset Class Returns
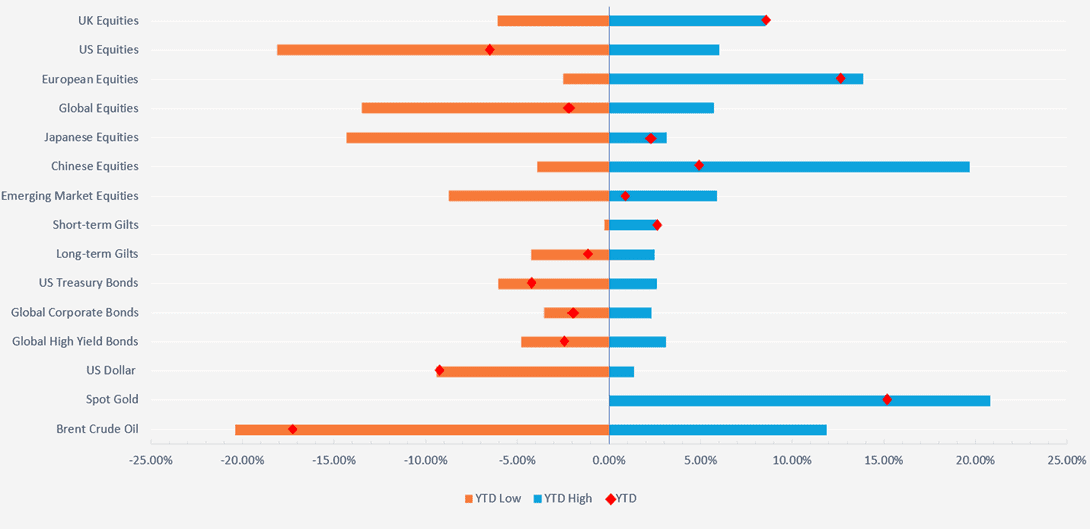
Selection of assets 2025 YTD returns and range of returns as at 02/06/2025 (the two ends of the bars represent the range of YTD returns and the red dots represent the current YTD return). Indexes used: FTSE All-Share, Russell 2000, STOXX Europe 600, MSCI China, MSCI Japan, MSCI Emerging Markets, FTSE UK Conventional Up To 5 Years, FTSE UK Conventional Over 15 Years, ICE BOFA US Treasury, ICE BOFA Global High Yield, ICE BOFA Global Corporate, US Dollar Index, S&P GSCI Gold Spot, S&P GSCI Brent Crude Spot. Returns hedged back to GBP with exception of US Dollar which is in US Dollar terms. Data from FE Analytics and MarketWatch
–
UK
Although the UK has agreed a trade ‘deal’ with the US, despite being one of America’s closest allies the UK is still stuck with a 10% tariff on exports to the US.
The UK is one of the few countries which has a trade deficit with the US and so relative to last year the UK is still in a worse off position. Also, and importantly, the deal is not legally binding and so does not mean much, especially with US trade courts saying many of Trump’s tariffs are not legal and Trump changing his mind very easily.
In this light, and following years of disputes with the EU since Brexit, the UK agreed a reset of relations under which the EU will remove much red tape and trade barriers on agricultural food products, and in return the UK will allow EU fishermen to fish in UK waters into the 2030s.
While the deal has its sceptics, and the EU are certainly expert negotiators, it is clearly a step in the right direction for the UK, forming bridges with other countries while the US increases its tolls for trade.
India is another example of a UK recent trade deal, with India lowering its mightily high tariffs on Gin and Scotch Whiskey.
While markets did not expect inflation to be as high as it was in April, the month did come with some obvious and well flagged indicators that inflation would be higher – think increased employer National Insurance Contributions, higher minimum wage and energy price increases. The most closely-studied element of the inflation figure, services inflation, rose from 4.7% in March to 5.4% in April (as the UK is predominantly a service based economy).
The gap between government borrowing and tax receipts also increased more than expected. With yields on longer term debt higher and more wealthy consumers leaving the UK, this is not too much of a surprise. We should see some sort of balancing as the effect of increased National Insurance Contributions comes in.
UK equities continued their positive performance this year, recovering the ground lost during Trump’s tariff announcements. The FTSE 100 has outperformed the S&P 500 by 15.75% so far this year in Sterling terms. Despite this being a short time frame for performance, over a five year period the FTSE 100 has now underperformed by just 14%.
I say ‘by just’ because at the S&P 500’s high point on 23rd January, the underperformance was 83%.
Overall YTD performance for the FTSE 100, FTSE 250 and FTSE Small Cap indices are 9.45%, 3.54% and 5.40% respectively.
The pound has strengthened against the dollar this year by over 7% and usually for FTSE 100 companies a stronger pound is a drag, because lots of their earnings are generated in US Dollars or other foreign currencies. A stronger domestic currency erodes these overseas earnings.
There are a few reasons for the strong UK equity performance this year. The first is that UK equities have been unloved for a fair few years now. With the lack of a strong technology sector, investors have preferred the US. This has created a valuation discount in the UK.
The second is that the UK lacks the productivity and innovation of other countries in many respects (robotics, clean energy, AI, labour laws, post-Brexit issues). Again, this has led to a valuation discount. However, despite this pessimism on past performance and headwinds, future performance looks potentially better than it has done for some time.
The UK has a strong track record of quality value companies which pay consistent and growing dividends. While the past five to ten years have all been about capital growth, history shows us that dividends have accounted for a large proportion of investment returns and we expect this to continue. For example, the current dividend yield on the FTSE 100 is 3.39% compared to 1.27% for the S&P 500.
As we can see in the chart below, the strongest sector performance this year has come from the banking sector. With interest rates expected to remain at higher levels, the profit that banks have earned on what they charge on loans (versus what they pay on deposits) has widened, with defaults remaining low. The Bank of England did reduce rates in May by 0.25%, but there was a split voter base on the Monetary Policy Committee, with some opting to keep rates where they are. This raises doubts about how many rate cuts we will see this year.
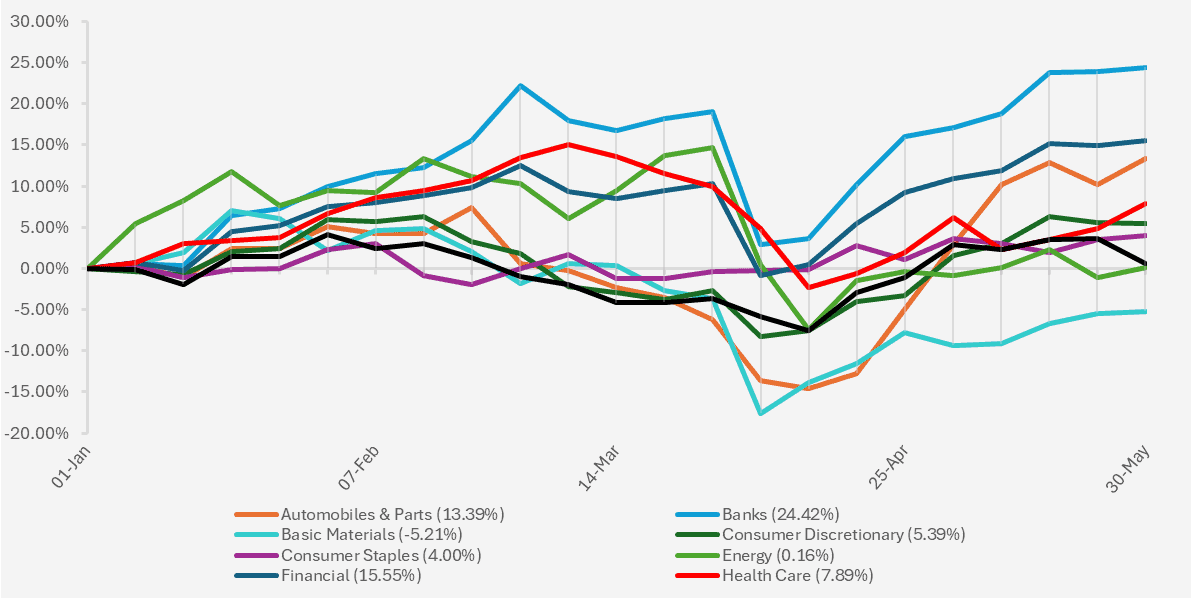
Chart showing YTD performance of various FTSE All Share sectors (Source – Watson French with data from FE Analytics. Underlying indices are FTSE All Share sectors).
Automobiles & Parts had been down as far as 17% this year, but a tariff agreement with the US helped the sector to rebound to over 11%. Still there is big risk in this sector and we see competition from China and the ever threat of tariffs from keeping the sector from moving much higher.
Other defensive sectors such as Healthcare and Consumer Staples performed well, as investors often prefer these companies which have stable cashflows in times of volatility. Interestingly though, we have seen consumer discretionary services remain positive for the year. A few points on this. First, as we discuss below, despite saying they are not, consumers are still spending. Two, depressed valuations over a number of years mean that there is not much more room for these companies to fall.
Finally, the valuations show investors are just not pricing in a recessionary scenario, potentially underestimating future risk. We can see this when we look at the performance of the FTSE 250 and FTSE Small Cap indices, where performance since the April tariff announcements has turned positive having been negative for most of the year – despite none of the underlying fundamentals changing, other than a move away from US assets.
Energy companies also fell, with oil prices down this year amid increased output from OPEC+.
Consumer Sentiment
We continued to see some contradictory data in April in the UK, with consumer sentiment picking up slightly but still remaining in negative territory, while the value and volume of retail sales picked up and GDP growth was stronger than expected. This is not something unique to the UK. Both in the US and globally we have seen consumers saying they are feeling very negative while still going out and spending.
Consumer sentiment is classed as “soft” data, as it is based on surveys of what people are feeling and saying rather than what they are doing. This is an important factor in economic analysis as in theory, if people say they are spending less and that their incomes have decreased relative to spending, then this should be reflected in their actions.
However, since 2019 this has not been the case. During the pandemic people were feeling negative and saying they were not spending, and yet people were still going out and buying TVs, washing machines, and so on.
A recent study by the Federal Reserve in the US found that consumers overestimated the inflation they personally experienced between 2019 and 2024, while saying they felt worse off and stating their spending had increased more than their income had increased (a link to the research can be found at the end of this commentary). Contrary to these feelings, the data actually shows that consumers’ real income had increased.
For example, 24% of consumers in the survey believed they had experienced inflation of over 40% between 2019 and 2024. The actual data looking at spending showed only 1.7% experienced this level of inflation.
Although the study took place in the US, the same relationship is happening in the UK and so we can assume the underlying findings will be somewhat similar.
So why are consumers saying that they are feeling worse off when perhaps they are not so? We are presently in an inflationary episode, which is similar to past episodes where this phenomenon has been more closely viewed. Consumers focus on prices more than their income, especially as this is what we read about in the media on a daily and weekly basis.
If we link this to human behaviour and psychology, Paul Ekman’s widely accepted view is that humans have six universal emotions, four of which are negative – happiness, sadness, anger, fear, surprise, and disgust.
This stems back to our early evolution as emotions were needed to warn us away from danger. It is ingrained in us and has never changed, and as a result we tend to place more emphasis on bad outcomes then good outcomes.
When we are not in inflationary episodes this is seen to be a more positive environment, and our brain can focus on the two positive emotions more. In more negative environments our evolution kicks in and we focus on the negative emotions; that is, we place less focus on growing incomes (good) and more on the negative rising prices (bad). We see this in the data, with UK wage growth still going strong in real terms. During the period January to March wage growth was 5.6% (1.8% in real terms).
While markets may seem like a numbers game, human emotions are a huge driving force behind it.
How does all of this link to markets at the moment?
If consumers are feeling negative, there are two main implications. The first is inflation anchoring (which is what the Fed is most concerned about). If consumers believe inflation will be higher this can often become a self- fulfilling prophecy. Firms often raise prices in expectation of this effect and consumers may demand higher wages, in turn pushing firms to raise prices further.
This is why in Jerome Powell’s statements he focuses on the idea of inflation anchoring. Even though inflation has come down much closer to the central bank’s 2% target, the risk of inflation anchoring is still high if this is what consumers focus on. The Fed’s job is to make consumers and markets believe that monetary policy will remain restrictive to keep inflation low.
The second is that if consumers are saying and doing two different things, it makes it hard to analyse the market and forecast what may happen. In turn this means higher volatility and larger swings in prices, as actual data may turn out to be different from what was expected.
–
Europe
Despite the threat of tariffs, Europe has continued to benefit from a renewed investor interest in the equity markets. Looking at fund flows this year confirms this.
Data from Morningstar showed the net flows into global tracker funds which exclude the US were positive at $2.5 billion between December and April regaining the funds lost between 2022 and 2025 in a matter of months.
The key factor to evaluate here is whether investors are doing this because they have lost confidence in the US as a market, due to the administration’s policies or because markets are expected to stagnate over high valuations, or whether Europe’s recent policy developments are a key driver of growth and a real turning point.
I do apologise, but it is impossible at the moment not to talk about the US even when looking at Europe!
Nonetheless, European regulators are trying to give the economy a boost. A big risk they face is oversupply from China, which is trying to find alternative markets to the US. To combat this they are introducing a €2 handling fee on small packages entering Europe, which will mainly affect China.
Technology is another area which is clearly lagging the US, and recent interviews in the Wall Street Journal have shown entrepreneurs trying to set up technology companies in Europe find it much harder than they do in the US, and so end up starting there instead.
With questions being raised over the position of the US dollar as a safe haven asset, certain parties within the EU are taking note. European Central Bank President Christine Lagarde pointed out that the present situation is an opportunity for the euro to increase its potential as an alternative reserve currency.
The solution to this is for the EU to operate as a centralised financing mechanism – that is, rather than having each member state issue its own government bonds, the EU as a central party does this.
Sounds simple enough? Not so. With 27 member countries of the EU, each with varying credit quality, economic fundamentals and consumer needs, the process of agreeing and implementing this would be very difficult. The Euro area government bond market was valued at over 8 trillion Euros in 2024 (just over $9 trillion based on today’s exchange rate), and therefore this is just not big enough to provide the liquidity needed to absorb daily trading volumes.
All of the major European equity markets are in positive territory for the year, but as the chart shows the divergence in performance is quite large.
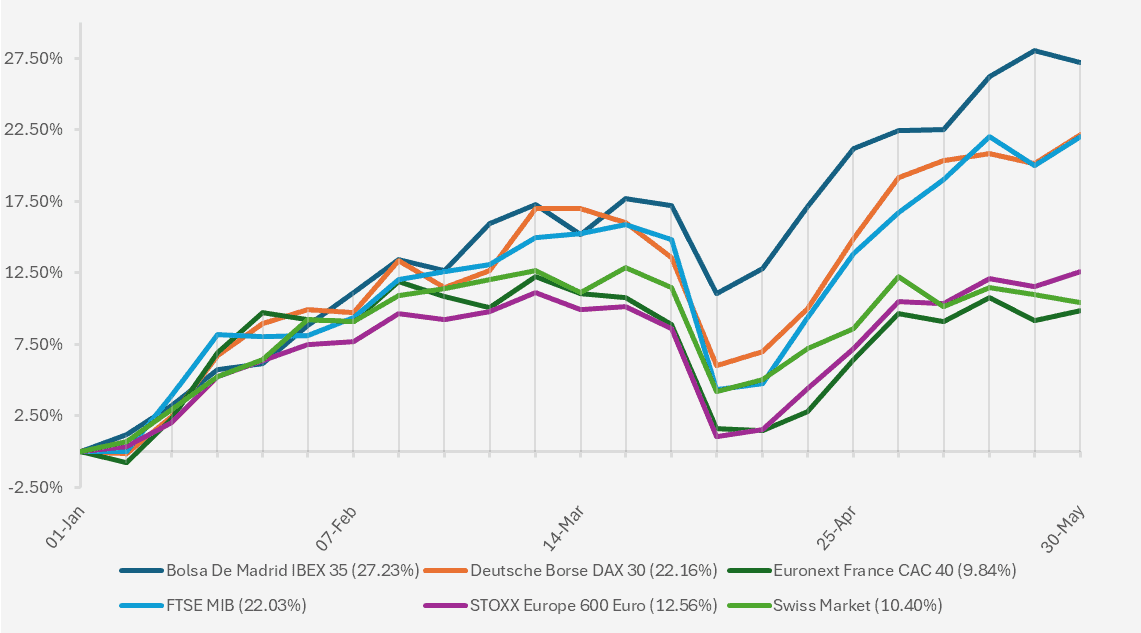
Chart showing YTD performance of major European stock market indices (Source – Watson French with data from FE Analytics. Returns hedged to GBP).
The Spanish and German markets have led the way, with Germany benefiting from the removal of the debt brake and the announcement of a huge package of spending. As has been widely reported, defence companies in particular have benefited from this.
One point to note is that the Dax 30 index is fairly concentrated. The S&P 500 is often analysed in this respect with the “magnificent seven” tech companies making up around 34% of the index. Within the Dax 30, SAP SE is the biggest stock and accounts for nearly 15% of the index by itself, and the top ten companies in the Dax make up 58% of the index.
–
US
The US budget deficit looks likely to expand further with Trump’s new tax bill set to roll through congress. One element of this deficit, which we will focus on here, comes from spending on healthcare, which last year reached $4.5 trillion dollars.
While the US has a bigger population than the UK and each individual European country, its healthcare spending per capita is much higher. Despite this, average life expectancy and the rating of the healthcare system is lower than that of other developed countries which spend less on healthcare per person.
There are structural reasons for this difference and an ageing population only puts more strain the system, coupled with a stricter immigration policy.
Turning to investments, with more spent on healthcare and a widening deficit, the cost of US debt will increase – that is, longer term US debt yields will rise, as supply will increase and investors will sell their debt holdings to move to shorter maturities or to other global markets (all else being equal).
To further add to this, defined benefit (final salary) pension plans have been winding down in greater numbers and are being used much less. The institutions managing the investments on behalf of the schemes have often purchased long-dated debt to match their liabilities. With demand expected to decrease from these sources over time, supply will have to contract or yields will move up further.
A lagging healthcare system and poorer outcomes relative to other countries will restrict more of the eligible workforce from engaging in work, lowering productivity and labour supply, potentially pushing labour costs up over the medium to long term.
Coupled with a strict stance on immigration and a crackdown on elite universities (deterring overseas students from attending – which was one way in which the labour force had grown, as these students often stayed to work after), a continued strain on the healthcare system will push up inflation over the long term. This means higher interest rates and potentially slower growth.
The US Federal Reserve (as expected) held interest rates steady in May. In the Fed’s five year framework review, Jerome Powell stated that “We may be entering a period of more frequent, and potentially more persistent, supply shocks — a difficult challenge for the economy and for central banks”.
Essentially, add all of this together and it points to a future with structurally higher inflation. Markets have switched from pricing in four interest rates cuts this year to two, with some investors pricing in no cuts at all.
As we will show below, markets have moved much higher since their ‘Liberation day’ plummets and this leads us to believe the downside risk is greater than the potential upside. In the words of Powell, ‘the tail is always bigger than you think’.
Trump directed an executive order in May pushing the administration to restrict the price it pays for drugs to that which the lowest paying country pays for that drug. This is difficult to see how it plays out in practice, but it has impacted healthcare and biotechnology stocks over the past month. The broad S&P 500 index is down just over 6% this year to date in sterling terms, while the pharmaceutical sector is down over 12%.
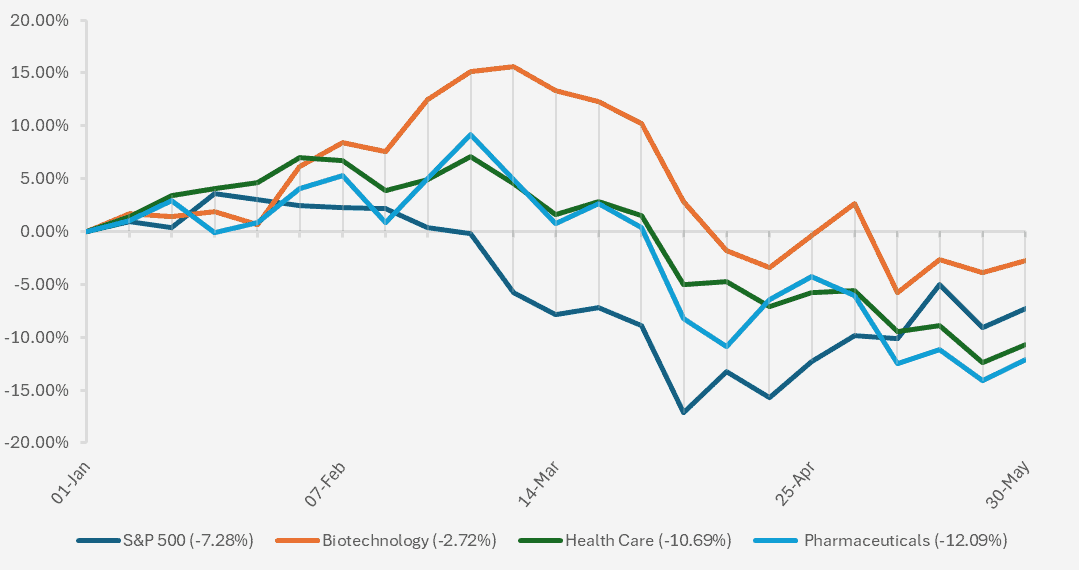
Chart showing YTD performance of healthcare, pharmaceutical and biotechnology sectors of the S&P 500 (Source – Watson French with data from FE Analytics. Underlying indices are S&P 500 sectors. Returns hedged to GBP).
Clearly the administration is aware of the healthcare issue and is attempting to rectify it by lowering drug prices and making changes to its Medicare and Medicaid systems, but with slowing economic growth and an ageing population we see this as a long term problem that won’t be resolved quickly.
With US markets returning to positive for the year in US Dollar terms, the question of valuation has reared its ugly head again. We reiterate the difference between price and value here, as it is always worth remembering. Price is what you pay, value is what you get.
It’s difficult to precisely measure a valuation as there are different ways of valuing a stock. The most commonly-quoted measure is the Price to Earnings ratio (how long the stock will take to repay the price you pay for the current earnings of the company), which does point to US markets having above historical average levels of P/E ratios, but this is an accounting measure which is easily distorted.
A useful measure but one that is less widely used is the Shiller Cyclically Adjusted Price Earnings ratio. This essentially turns the P/E ratio on its head and looks at the earnings yield of an index which can then be compared to bond yields. This then highlights the premium that investors receive for investing in riskier equities.
Data by the Wall Street Journal shows the current S&P 500 earnings yield is 2.8%, which is 1.4% above the inflation-adjusted Ten year Treasury yield (as at 17th May). This is below the historical average and shows the investors are willing to accept a lower premium for holding equities.
Past periods show that a smaller excess yield has generally resulted in a smaller return from equities relative to bonds over the following ten year period. While this does not mean equities won’t generate positive returns, it does mean the returns may not be as high as they have been in recent years, especially with longer term US bond yields remaining elevated and bonds offering attractive rates of returns, both nominally and in real terms.
Another point of concern with the US economy is a struggling housing market. Pending home sales sank 6.3% in April, and are down 2.5% this year.
US home sales are important for several reasons. Typically, when US consumers move home or buy their first home, this is the period in which they spend more money than they do during any other period in their life. Think of home improvements to sell their property or home changes in their new house to make it how they want it.
US mortgages are nearly all fixed for 15 or 30 years and are not priced off of the US Federal Funds Rate, but 7 years plus US treasury yields. If a US consumer wants to move house, they have to pay off any remaining balance on their mortgage and remortgage at a new rate (unlike in the UK, mortgages cannot be ported).
Yields on the US 30 year treasury are just below 5% and slightly below their level post the 2008 GFC, but above their pandemic lows of 1-2% (potentially a normalisation in yield levels rather than an abnormal period of high yields).
Anyone who purchased a house over the last two years will therefore have a much higher level of interest costs and consequently less to spend on other GDP-boosting goods and services. If a consumer moves now or purchases a new house, this is a problem they face. Consumers who purchased their property during the Covid-era of very low interest rates will probably not want to move house, as their mortgage repayment burden will increase by a significant margin. All of this is to say that there are large weights holding the US property market down.
With US home sales under pressure, this could mean that consumer spending slows, dragging on US economic growth. Rates need to come down in order to spur this growth, but inflation risk and expectations of high inflation are kneecapping the Fed into waiting.
We all remember President Trump saying ‘drill, baby, drill’, but with global oil prices falling this year due to OPEC+ supply increases, this just has not happened. Oil producers need prices to be above a certain level for their activities to be profitable (one survey put this at $61 a barrel). On the other hand, lower oil prices make filling up the car, or for airline companies the planes, much cheaper.
With a temporary agreement to reduce the high tariffs on China (and vice versa), markets have reduced the chance of a US recession this year. In US Dollar terms the major US indices have recovered their ground for the year so far, but in sterling terms investors are still in the red. Nvidia recently released its quarterly earnings which impressed investors and sent the stock price up 18% in just over a month. This helped to relieve investor fears regarding a slowdown in big tech earnings. Even with a limited ability to sell to China, Nvidia has continued to perform well.
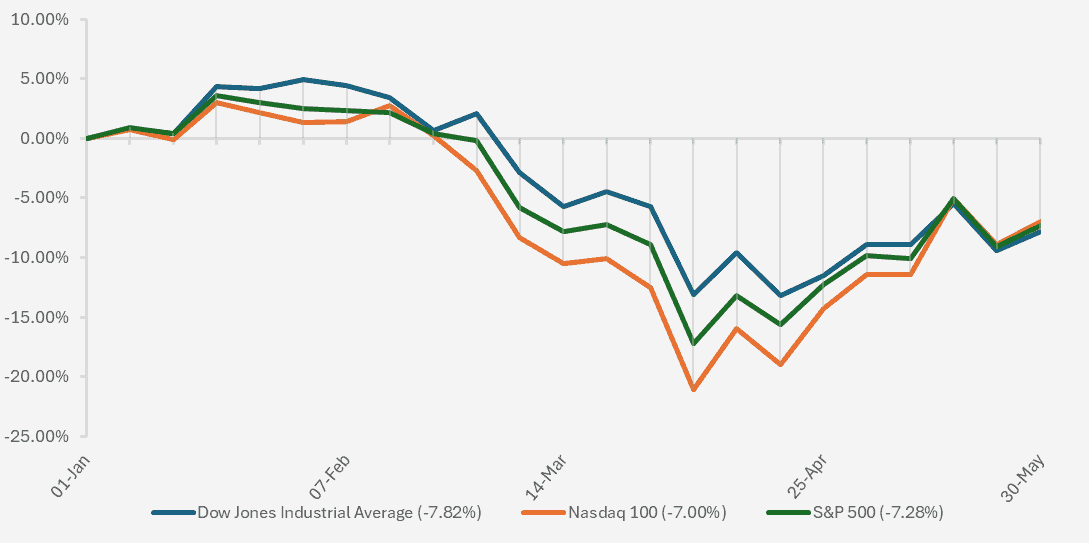
Chart showing YTD performance of major US stock market indices (Source – Watson French with data from FE Analytics. Returns hedged back to GBP).
Markets seem to be pricing very little in the way of downside risk and we certainly see the risk/reward balance titled to the downside because of this. After all, the tariff reprieve is temporary and we do not know what is to come or what may come if no more leeway is made. We saw this recently when Trump doubled the tariffs on steel and aluminium to 50%.
Recent investor surveys show that the belief in big tech is still present, with many believing the Mag-7 will continue to outperform over the next three years.
–
Emerging Markets
This month we saw a huge rise in the Taiwanese Dollar relative to the USD, with the currency appreciating by 9.6% in four trading days. For equity markets this may be normal functioning, but in currency markets this is a big deal.
There are various theories seeking to explain this increase. Taiwanese life insurers hold a large volume of US Treasuries, as they are safer and presently pay a tidy yield. This sounds fine so far, but the problem is most of their holdings were unhedged and at risk of movements in the USD.
If Taiwanese insurers suddenly wanted to hedge more of their exposure, this involves selling the USD. Similarly, if they sell their US Treasury holdings this will weaken the USD.
Another theory is that the strengthening of the US Dollar was negotiated with Taiwan in their trade negotiations. This has been disclaimed by the parties involved, but if true does present a big risk and further issues if other countries are ‘asked’ to do this and refuse.
A strengthening local currency for emerging markets should be a good thing in terms of the affordability of their debt, which is often denominated in US dollars. But a stronger currency also makes it more expensive for them to export and thus less competitive. With pressure from China this could hamper growth further.
The high tariffs on countries like Vietnam and Taiwan have overshadowed this weakening of the US dollar. Despite the potential tariffs though, Vietnamese markets have mostly ignored this and regained the ground lost initially. This suggests that if a deal is not reached, we will see values drop further, again highlighting the downside risk.
We also see from the chart below the divergence in performance between the mainland Shanghai stock index and the Hong Kong-based Hang Seng index. The main reason for this huge differential is the higher weighting of technology stocks such as Alibaba in the Hang Seng index.
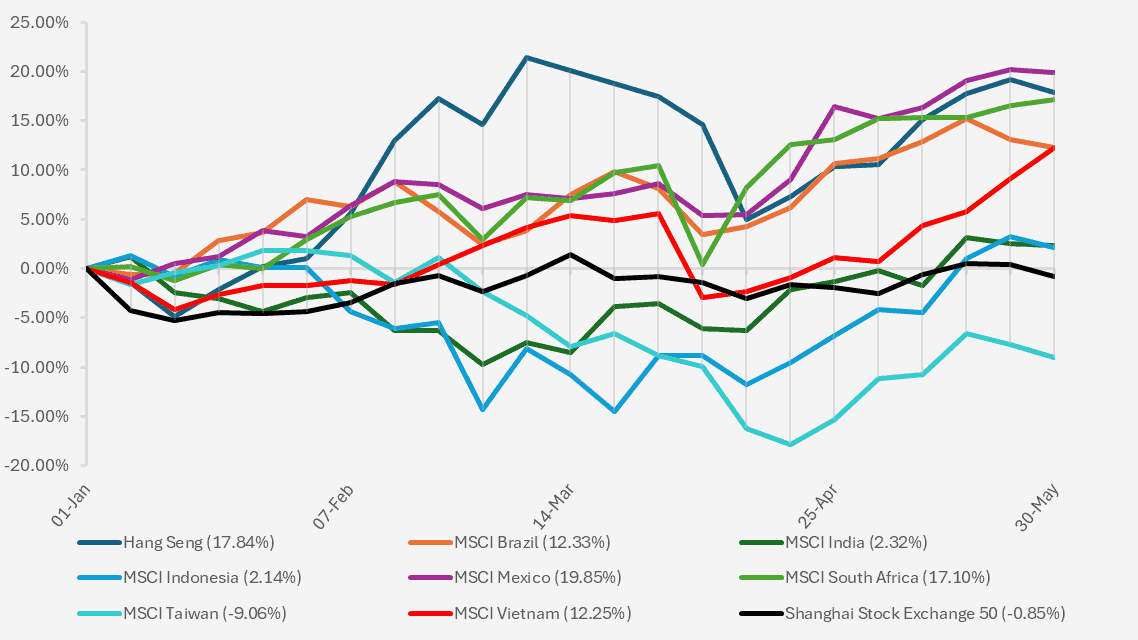
Chart showing YTD performance of various emerging market stock market indices (Source – Watson French with data from FE Analytics. Returns in local currencies).
A lot of emerging market talk is dominated by Asia Pacific, but Latin America is also an important region which has been ignored for long periods. Mexico and Brazil are seen as beneficiaries of the trade war and have seen their stock markets rise accordingly.
Brazil in particular has structural issues and trade controls which make the region unattractive, but with a presidential election next year investors are considering whether these controls may be relaxed, potentially opening up the closed economy up for investment and trade.
India continues to look attractive as a long-term investment, especially given the difficult prevailing six months (at the start of March the MSCI India index was down 10% in local currency terms). A growing demographic, digitalisation and relative shelter from the trade war all stand to act as tailwinds for the subcontinent. Geopolitical tensions on the border continue to pose risks though.
Federal Reserve research article – The Fed – Tracking consumer sentiment versus how consumers are doing based on verified retail purchases
–
Robert Dougherty, Investment Specialist
June 2025
This article is not a recommendation to invest and should not be construed as advice. The value of an investment can go down as well as up, and you may get less back than you invested. Data is correct at time of writing and cannot be guaranteed.