1st October 2025
Interest rates were cut as expected, falling by 0.25% with the federal funds rate now sitting in a range of 4% – 4.25%. The cut was described by the Fed as a risk management cut owing to the risk of a worsening labour market.
Taken with the Fed’s projections for inflation and growth the Federal Reserve seem to be cutting rates in a cyclical upswing. The market’s reaction was muted, as the rate cut was widely expected. One could question whether the Fed cut rates because of market expectations, with the rationale of a risk management cut fairly weak and the effect of a 25bp cut on mortgage rates and the wider economy being relatively insubstantial. The Fed’s “Dot Plot”, which shows each Federal Reserve official’s expectation for interest rates in the future, showed two more possible rate cuts this year.
Equity markets continue to move higher with fundamentals stretching further, as revenue growth, while positive, has slowed down with capital expenditure very high. A few well-known quotes are apt to describe the current market we are in and what investors are thinking. First, a famous quote by Paul Samuelson – ‘stock markets have predicted nine of the last five recessions’. Second, a quote by former Citigroup CEO Chuck Prince – ‘As long as the music is playing, you’ve got to get up and dance. We’re still dancing’.
And that’s just it; the bears are thinking that the market is destined for a downturn and the bulls keep driving the market higher. Momentum is hot and the fear of missing out is everywhere in markets.
We see a combination of liquidity in the system from previous quantitative easing cycles by central banks, a new period of technological innovation and the rise of the retail investor and social media usage keeping markets higher. We do not necessarily see a sharp drop in markets from economic changes this year but there is a risk of investor sentiment changing.
This would take the steam out of the rally and we could then see a stagnation or a sustained bear market. It is difficult to forecast what could cause this but in the meantime, investors have to ‘keep dancing’ and remain diversified, looking at fixed interest for attractive yields and other regional equity such as Japan (for corporate reforms and increasing returns on equity) and emerging markets (for strong performance on the back of a weaker dollar, and central banks which are further into their rate-cutting cycles) for strong return potentials.
We have continued to see the steepener trade in global government bonds play out this year. That is, investors are buying shorter dated government bonds while selling longer dated bonds as short term yields fall and long term yields rise. Short term yields have continued to drop as interest rate cuts are being priced in, but as central bank actions do not move the long end of the interest rate curve these yields are being driven up by demand forces and fiscal concerns i.e. a more structural shift.
Corporate bond spreads continue to compress, with some companies actually paying less than governments to borrow money. Further spread compression is unlikely with the risk skewed to a widening of rates.
President Trump floated the idea of US companies being required to report earnings twice a year rather than quarterly and this has stirred up much debate. It could be seen as a good thing as it allows CEOs to focus more on longer term growth, but it could also limit information for price discovery and reduces the accountability of CEOs. This is something markets are watching. If investors cannot price a stock as accurately because information is more limited, the cost of capital for companies will go up and that means lower valuations.
Fiscal sustainability is a concern for many major economies but recently France has hit the headlines as Prime Minister François Bayrou was ousted in a no-confidence vote this month. President Macron has since introduced Sebastien Lecornu as the new Prime Minister and he now has the difficult task of reducing France’s deficit, either by spending cuts or tax increases. The yield on French government bonds moved higher and is now comparable to Italy and Greece, two of the riskier economies in the European bloc.
The Bank of England met this month to vote on interest rates, opting to leave them at 4% as concerns over inflation persist. Looking at UK debt yields, general market consensus and forecasts for the UK, most point to higher inflation relative to other developed markets. The OECD for example forecasts the UK to have the highest inflation in 2025 of the G7 economies (3.5%). We could see inflation rates come down as National Insurance increases and National Minimum Wage increases wear off, but (likely) tax increases in the upcoming Budget could prove to further fuel inflation. Markets expect just two rate cuts in 2026, bringing the base rate down to 3.5%.
–
Areas of Focus
- Yield curves continue to steepen with short term rates dropping and long term rates rising. With central bank rates not expected to fall as much as previously thought, both ends of the curve offer opportunities, but with more risk in the long end.
- Corporate spreads remain tight, indicating strong financial conditions, or alternatively, investors’ preference to lend to corporates with stronger balance sheets rather than governments under fiscal dominance pressures.
- Energy and utility stocks continue to be hot as the demand for AI energy needs keeps on picking up.
- Technology companies remain a key allocation even with valuations stretching further. Circular revenue flows have added concerns over tech company valuations though.
- Small cap stocks have performed well in the US, but with around 40% of the companies in the Russell 2000 being loss-making, we see risks as growth is valuation driven, not fundamentally driven.
- Corporate and high yield bond spreads remain tight and we continue to see the risks skewed to the upside.
–
Asset Class Returns
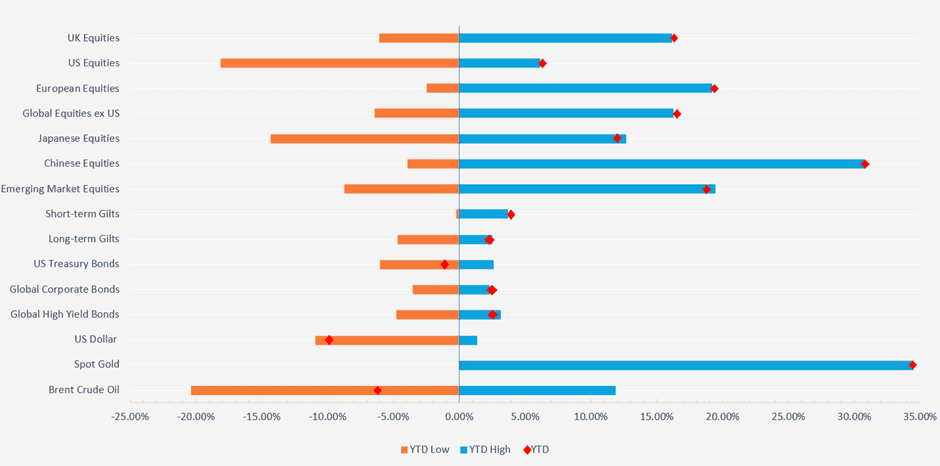
Selection of assets 2025 YTD returns and range of returns as at 30/09/2025 (the two ends of the bars represent the range of YTD returns and the red dots represent the current YTD return). Indexes used: FTSE All-Share, Russell 2000, STOXX Europe 600, MSCI World ex USA, MSCI Japan, MSCI China, MSCI Emerging Markets, FTSE UK Conventional Up To 5 Years, FTSE UK Conventional Over 15 Years, ICE BOFA US Treasury, ICE BOFA Global Corporate, ICE BOFA Global High Yield, US Dollar Index, S&P GSCI Gold Spot & S&P GSCI Brent Crude Spot. Returns hedged back to GBP with exception of US Dollar which is in US Dollar terms. Returns based on daily returns. Source – Watson French with data from FE Analytics and MarketWatch.
–
US
This month we are focusing again on the AI technology trend, looking at the potential downside risks we see to the rally before looking at the Federal Reserve’s September interest rate decision.
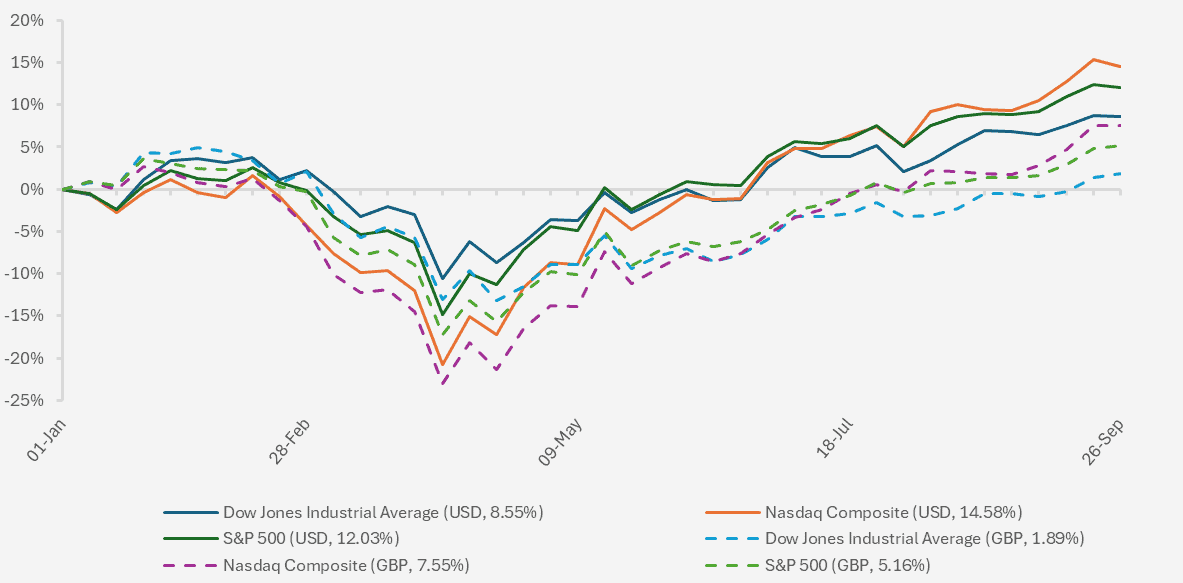
Chart showing YTD returns of major US equity indices (Source – Watson French with data from FE Analytics. Solid lines shows the returns in US Dollars. Dashed lines show the returns in GBP. Data based on weekly returns. Data correct as at 29.09.2025).
US equity markets have continued their strong rally after the early April slump. Technology stocks have continued to lead the way, as shown by the NASDAQ Composite index (a technology-heavy index) outperforming the Dow Jones Industrial Average (more traditional blue chip or ‘old school’ stocks such as Coca Cola).
For UK investors their pound sterling returns only became positive in mid-July for the NASDAQ and S&P indices, and for the Dow Jones index the return only turned positive in the middle of September. With the pound strengthening versus the dollar (or the dollar weakening versus the pound) this has been a drag on US equity performance when translated back into pounds. Unhedged indices have continued to move higher showing investors still believe there is room to run for US companies.
–
US Dollar
More overseas investors are looking to hedge their US asset holdings as they expect the US Dollar to continue to weaken relative to global currencies. The proportion of investors in US ETFs hedging their investment has overtaken the proportion that are unhedged. For years investors remained unhedged to benefit from a strengthening US Dollar along with a rising equity market.
We can certainly see the potential for further US Dollar weakening but much depends on what path the Fed takes on interest rates. Currency changes can usually be attributed to interest rate differentials between two countries and on the usual metrics the dollar has moved into undervalued territory (based on data by Vanguard). Therefore we would expect the dollar to strengthen but with fiscal concerns, Fed independence concerns and geopolitical issues we may continue to see a decline in the value of the dollar.
As mentioned in a previous commentary, while a weaker dollar erodes returns for an overseas investor, it is beneficial for big US companies with a large proportion of revenue being generated overseas. Currency movements tend to be cyclical and self-correcting, and with the advancements in the US Dollar stablecoin market it is not a given that the dollar will continue to depreciate. On the flip side, if the dollar is declining due to lower investment flows into the US, we may see US share prices fall. It is difficult to forecast how these two competing forces will affect share prices over both the short and long term.
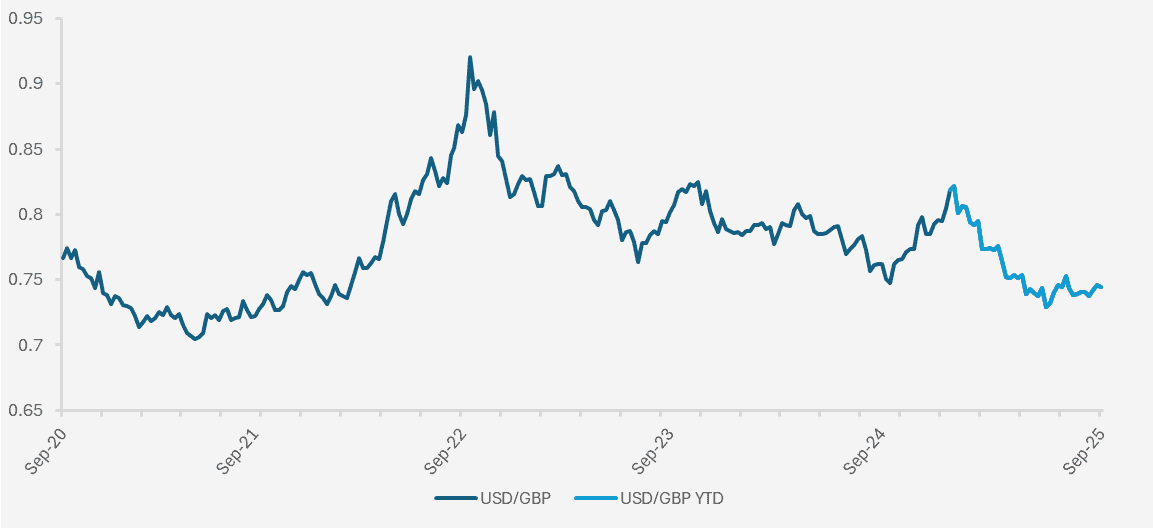
Chart showing the exchange rate of USD/GBP over a five year period (Source – Watson French with data from Investing.com. Data from 01/09/2021 to 28/09/2025 Note: a declining value shows the pound strengthening and the dollar weakening and vice versa for a rising value).
–
AI & Valuations
He may not be as well-known as Elon Musk or Jeff Bezos, but Larry Ellison is a wealthy individual. When Oracle announced that they have $455 billion in contracted revenue that they will collect at the end of the quarter, while also having nearly $500 billion in total performance obligations and $317 billion in new performance obligations, Oracle’s share price rocketed.
At the height of the 44% increase in Oracle’s share price following this news, Ellison’s net worth had increased by $100 billion (in less than a day).
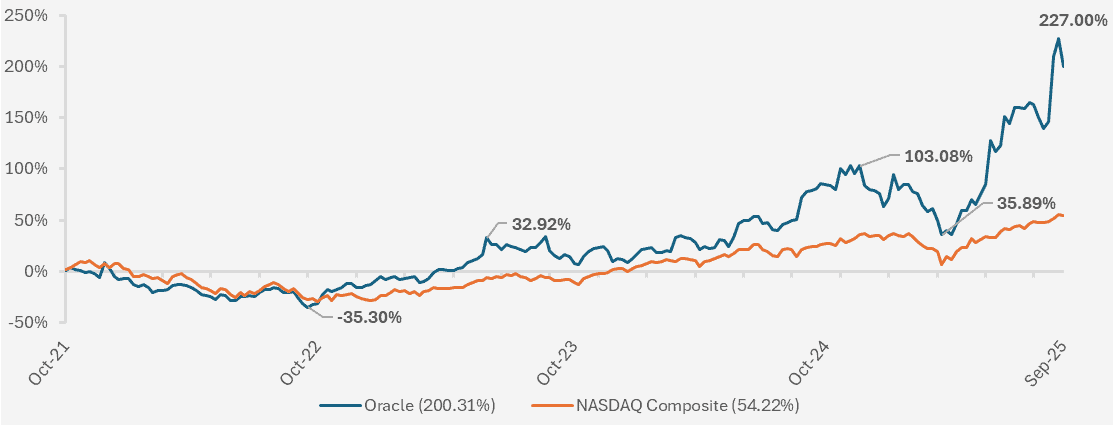
Chart showing the five year cumulative performance of Oracle Corporation and the NASDAQ Composite Index (Source – Watson French with data from Investing.com. Returns are in US Dollars and based on weekly data. Data callouts show the cumulative return of Oracle at various dates. Data correct as at 29.09.2025).
This is very impressive but there are risks hidden within this narrative which have wider implications for the AI buildout and the strong equity market. ‘History doesn’t repeat but itself, but it often rhymes’ – Mark Twain.
This quote is relevant when talking about whether there are similarities or not between the period we are in and the dot com boom. The main argument as to why we should not compare the current period to the dot com period is that the companies back in the late 90s were not actually making any money, but today they are. Another point is that in the 90s companies were piling on debt to finance this expansion and today they are only just starting to really use leverage – a point which is not so true if we look deeper and off-balance sheet.
While the earnings point is true, we cannot ignore the fact that inherent in a stock’s price is the expectation for future cashflows, not just cash flows today. Furthermore, high capital expenditure has to be rewarded with higher earnings and higher shareholder returns in the future. With such large sums of capital being invested in AI infrastructure it is not a given that this will be rewarded sufficiently.
Technology companies today are making tidy profits with strong margins, but that doesn’t mean they will in the future – and with high valuations, any misses will be punished. The growth in their profits must keep up with expectations. A move away from quarterly reporting could ease some pressure on CEOs, but will also cause further volatility when results are finally announced and earnings targets are potentially missed.
We know what the potential for AI is and we all hope that markets continue their trend upwards, but it is equally prudent to focus on what could go wrong and that is what we are doing here. Again, we don’t expect this to happen but will explore it as a “bear case” scenario.
To highlight the above point of future cashflows being important, of the $317 billion in new performance obligations for Oracle, around $300 billion of this comes from a single customer – OpenAI. The creator of ChatGPT is on track to make $11 billion in revenue this year but it is not actually making any profit. In 2024 it was reported that the company lost $5 billion and the CEO Sam Altman, told investors he expects the company to lose $44 billion in total through to 2029.
The company burns through cash each year to fund AI research & development and data centre construction, among other things such as developing an AI companion as a new technology for consumers. Each new AI model it develops is much more expensive than the last one and the latest release of ChatGPT 5 was underwhelming for both users and investors.
As a private company, funding comes either from debt issuance or private equity funding rounds. At the last funding round the company was valued at $300 billion – a large sum for a company not making any money. This again highlights how much of the value is priced into uncertain future cashflows.
Over 700 million people use ChatGPT, but globally only 3% of consumers actually pay for AI. We also highlighted in a previous commentary an MIT survey that showed 95% of organisations who responded to the survey said they are getting no return on their AI investments. Analysts estimate that OpenAI will need to generate $300 billion of annual revenue by 2030 to offer attractive returns on their investment (a increase in revenue of 2,627%).
Many other major technology companies also have AI offerings such as Microsoft and Meta. Meta expects to spend around $70 billion in capital expenditure this year, but they also make billions of profit each year and can fund this expenditure without borrowing.
So if OpenAI was to become a failure, does it matter? After all, it is only one company and one which is private.
If OpenAI failed, that $300 billion of revenue that Oracle expects would disappear, causing its stock price to plummet. This would likely have a knock on effect for other stocks, as investor sentiment would turn negative quickly.
Oracle also needs to fund its infrastructure network in order to receive this revenue. Operating cashflow has been wholly spent on capital expenditure and its free cash flow isn’t expected to be positive for most of the rest of the decade. This is where borrowing comes in. Another prime example is CoreWeave, which previously had nothing to do with AI and instead focused on mining Bitcoin. It essentially leases out data centres which it has fitted with Nvidia chips. Its borrowing has been high and it has a market cap of nearly $60 billion, partly owned by Nvidia as well.
Add in the more recent news of Nvidia, the world’s largest company, investing up to $100 billion in OpenAI and we see even more circular revenues.
It isn’t uncommon for a customer to invest in a supplier, ensuring their supply chain is in place and they can order the goods they need to then sell onto a third party. It is however unusual for a supplier to invest in its customer. Nvidia will invest in OpenAI and receive revenue from the GPU chips used in the datacentre construction. Analysts see a relatively small level of risk in the deal because the investment by Nvidia can be funded by its cashflows. However, just because something can be done doesn’t mean it should.
Nvidia is putting a lot of weight behind OpenAI becoming profitable and advancing its generative AI capabilities. If this succeeds it will be a big payoff for Nvidia. We could see these transactions as circular or as Nvidia backing who they see as winners.
Oracle isn’t the only company with a high valuation and a lot of expectations to live up to, but many new AI companies are cropping up and are quickly being valued at billions of dollars. Oracle is valued at 44 times on a forward P/E basis (the S&P 500 average is presently around 23).
If companies fail or AI demand is lower there will also be a lot of infrastructure that is not needed, at least in the shorter term. With so much capital investment investors need to see a meaningful return. With each new AI model costing more than the last to develop, if investors do not start to see a return soon they will lose patience. Add in the increasing debt that companies who are not in the Magnificent Seven need to use and this could spill out into the private credit sector and the other corporate markets.
The financial ecosystem is highly interconnected and if we see a slowdown or failure in one company, this can quickly domino into others. Again, we don’t expect this to happen but it is a risk to be aware of. The implementation and positive effects of AI may take a lot longer than investors currently think.
Also, with US household investor allocations to stocks at their highest level in history and the Cyclically Adjusted P/E ratio at a multi-decade high, we shouldn’t expect the huge returns we have seen over the past three years to continue for the mega cap companies.
In summary, we need to watch out for debt levels, circular revenue flows, earnings growth, valuations, AI adoption and productivity increases among businesses and consumers, as well as AI model advancements and competition from overseas competitors e.g. Chinese technology companies.
–
Federal Reserve & Interest Rates
Jerome Powell led the Federal Reserve to cut interest rates by 0.25% in September, with just one dissenter, the newly appointed Stephen Miran who voted for a 0.50% cut. Previous outliers Christopher Waller and Michelle Bowman opted for a 0.25% cut, showing some unity among the governors.
Markets expected a cut but it was the Fed’s “dot plot” (guidance on each official’s, including non-voting officials, expectations for future interest rates) which concerned markets. Nine officials forecast just one more 25bp rate cut this year, ten officials forecast two rate cuts of 25bp, one official sees no cuts and the last official (no guessing needed on who this is) forecasts 1.25% of rate cuts by the end of the year.
Looking at the dot plot it is amusing to see such a large outlier, but it important to have different views to avoid groupthink.
With the labour market and inflation data in tension, markets had perhaps expected (or hoped for) more rate cuts this year.
At the start of this commentary we pointed out that the Fed’s rate cut was a risk management cut and that they are cutting into a cyclical upswing.
In this context the term “risk management” means that the Fed has seen the upside risks to employment rise and they have decided to focus on making sure this does not deteriorate. How much a 25 basis point cut achieves this is questionable. They still see a pickup in inflation as a risk, but the unemployment risk has picked up as revisions to previous data sets show less jobs being added than previously thought.
The second part – cutting into a cyclical upswing – means that the Fed is cutting rates even though it expects over the next two to three years growth to pick up, unemployment to fall and inflation to remain above its 2% target. Cutting rates too much in this environment could cause inflation to pick up further and merit rate increases in the future.
A big effect on the US economy is how AI will impact productivity and what effect low immigration will have.
Stephen Miran detailed his views on the R* interest rate (the neutral rate of interest which neither stimulates nor contracts the economy) in his recent speech, looking more long term in his thinking. He made various points such as:
- lower immigration resulting in lower demand for housing and thus lower rental inflation
- pledged investment from overseas countries lowering US government borrowing needs and consequently reducing government bond yields
- tariffs revenues lowering US government borrowing and thus reducing the R* interest rate.
These may well be valid points but if inflation isn’t anchored downwards it won’t matter about the potential impacts of Trump’s policies, as rates will need to stay high. There is also a scenario where unemployment doesn’t deteriorate but inflation picks up; in this case we should be at least considering the prospect of rate hikes, something markets are not doing.
On a side note, although the R* rate is interesting it often doesn’t enter the conversation and it is notoriously difficult to determine what the actual rate is.
The Fed either has to stay cautious and go meeting by meeting looking at the data, or go with Miran and look longer term and potentially more speculatively. We expect the Fed to stick with its views and remain cautious but acknowledge that even the Fed is privy to behavioural biases like short termism, which may impact longer term needs.
The two year treasury yield remained flat this month, increasing by just 0.02% as at 25th September. So far this year the yield has decreased by 0.60%, a 14% drop. The relative flatness this month came as investors assessed the Fed’s expectations for interest rate changes going forward.
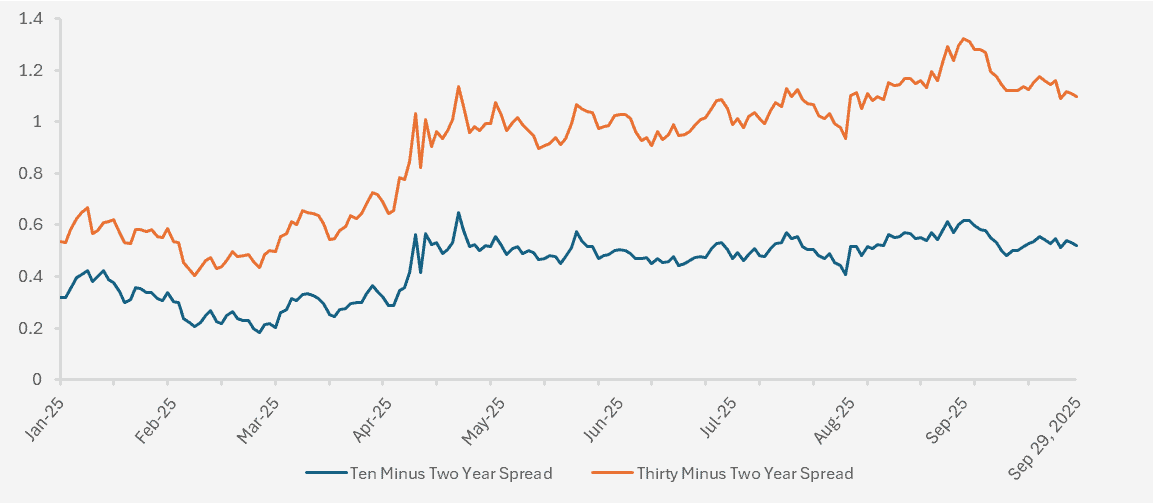
Chart showing the difference between the ten year US treasury yield and the two year US Treasury yield, and the thirty year US Treasury yield and the two year US Treasury yield. (Source Watson French with data from Investing.com. Daily opening yields used. Data correct as at 29.09.2025).
We could easily see the shorter-term yield drop further if the labour market deteriorates and the unemployment rate picks up.
With recent GDP data for the second quarter revised upwards from 3.3% to 3.8% and final sales to private domestic purchases (data measuring spending by US consumers and businesses on goods and services, leaving out international trade, inventory and the government) being revised from 1.9% to 2.9%, the US economy is still looking robust and further rate cuts may be difficult to pass if inflation remains above target.
Data also showed consumer finances were stronger than expected, with a $300 billion increase in personal income. While positive, most of this increase came from dividend income, not salaries. With stock markets at record highs we can clearly see the wealth effect in play here.
Having peaked at 4.61% this year, high yield bond spreads have ticked back down to just 2.7% above US treasuries. US investment grade corporate bond spreads remain at their tightest level since 1998, offering just a 0.75% premium over US treasuries. We do not expect spreads to tighten any further from here and see risks continue to be skewed to the upside.
–
Europe
European equity markets are still performing strongly this year although progress has stalled over the last month with markets mostly flat. The big news out of the bloc this month was the removal of French Prime Minister François Bayrou in a no confidence vote. France is heading down a dark path of fiscal unsustainability, with debt levels as a percentage of GDP rising and no plans in sight to address this.
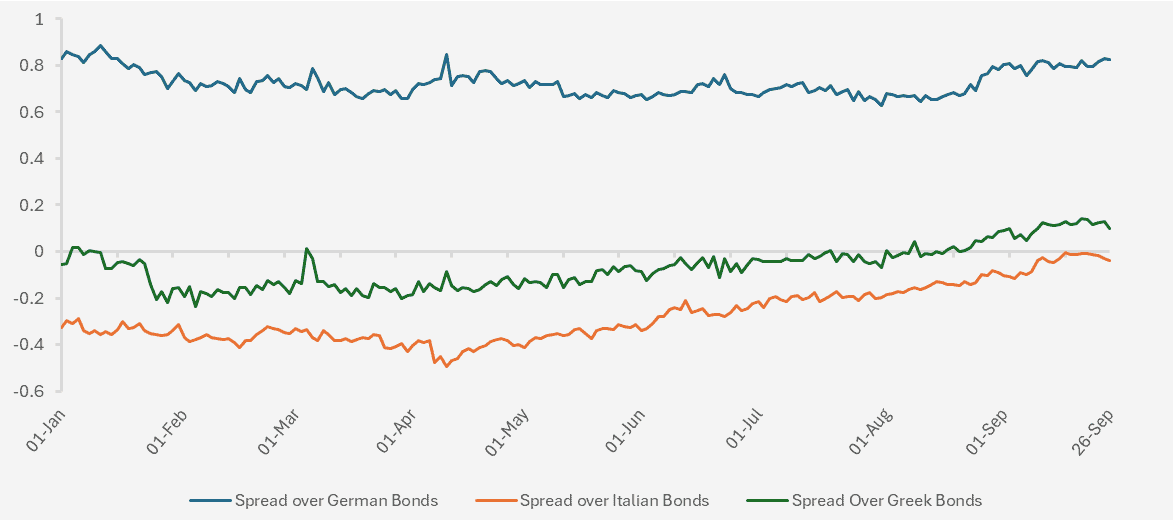
Chart showing 10 Year French government bond yields relative to 10 year German, Italian and Greek government bond yields. (Data correct as at 26.09.2025. Source – Watson French with data from Investing.com).
We can see market concerns over the government’s borrowing in the chart above, where the spread (the difference in yields) between French 10 year government borrowing and that of safer German government borrowing and relatively riskier Italian and Greek government borrowing is plotted. Comparing spreads in this way allows us to see how investors perceive the attractiveness of one country’s debt versus another. When the spread is positive this means the yield on French government debt is higher relative to the other country’s debt.
The spread versus German debt has stayed fairly constant this year. The yield on the debt for both countries has risen but for differing reasons. German debt yields have risen due to the removal of their fiscal debt brake and the huge investment into infrastructure and defence in the country. More supply and the same level of demand results in higher yields for German bonds.
The more interesting comparison is on the spreads versus Italian and Greek debt.
Italian debt has often been at the riskier end of the European government debt market. The economy is less stable and the debt level relative to GDP has been high. There were concerns when Italian Prime Minister Georgia Meloni was elected in 2022, but since then debt as a percentage of GDP has declined from a high of 154.9% in 2020 to 135.3% in 2024. This is still a high debt level but it is moving in the right direction and markets like this.
Greece has been in a troubled state since its debt crisis following the 2008 Global Financial Crisis. The country was downgraded from developed to emerging market status and its sovereign credit rating downgraded to junk status. Debt to GDP reached a high of 209.4% in 2020 but the country has been improving – debt to GDP has decreased to 153.6% of GDP in 2024 and its credit rating has been moving back up, now in investment grade status with a stable outlook.
France, the second largest economy in Europe (minus the UK) has higher borrowing costs than Greece and very similar costs to that of Italy. Again this is a fiscal story and we see that when we look at the French equity market (the Euronext CAC 40 is up 8.72% in Euro terms this year) and the fact that some French corporates such as AXA now borrow at a cheaper rate that the government.
French debt to GDP has been rising and sits at 113% of GDP as of 2024. High government debt levels are not a problem unique to France – we are seeing this globally including in the US and the UK. The main problem investors have with France is that there does not seem to be a solution in sight. The government cannot agree to raise taxes nor cut spending, a point evident by the country having had four different Prime Ministers since the beginning of 2024.
Debt in France has been high for a while and despite the EU’s strict limits on debt levels, France has mostly been allowed to skirt these rules as it was one of the founding members of the EU.
We continue to see risks for France unless a solution is agreed upon by the government. This also highlights another reason why a joint EU government debt fund is nigh on impossible – why would more fiscally responsible countries want to compensate for other countries lack of fiscal constraint? In our view this highlights the support for US treasuries as a safe haven and the strength of the US Dollar.
The rise in longer term government bond yields and in particular the episode we are seeing in France have a few implications. For France it doesn’t have the biggest impact on corporate yields because spreads are narrow and some companies are borrowing at cheaper rates. On the other hand, it may start to impact them if taxes are increased to raise revenue or if spending is cut by the government in order to meet rising borrowing costs. Governments may look to issue shorter term debt to take advantage of relatively lower yields, although this will ultimately increase the volatility of borrowing costs for governments and cause problems with long term projects such as infrastructure and AI needs.
Investors are therefore watching this episode closely to learn what may happen to other countries should they continue down the same path as France – of particular note will be the UK with the November Budget.
–
Robert Dougherty, Investment Specialist
September 2025
This article is not a recommendation to invest and should not be construed as advice. The value of an investment can go down as well as up, and you may get less back than you invested. Data is correct at time of writing and cannot be guaranteed.