31st October 2025
There is a lot to talk about with gold, so in this article we will touch on why investors like gold, who actually holds gold, the historical performance record of gold and how it has performed this year, and the potential long-term and short-term explanations for its recent performance. We also give our thoughts and conclusions on what could bring the price of gold back down.
Why is gold used as an investment?
Gold is seen as a safe-haven asset. It has been used for hundreds, even thousands of years as a store of value and at its core, it is just an extremely unreactive metal – an important property for something to function as a store of wealth.
Gold is a natural resource and so is not controlled by a government or any private institution when it is bought and sold in the market. While it is used for scientific equipment and jewellery, its industrial use it much smaller than its shiny cousin Silver. These uses do not produce enough demand to soak up the supply – i.e. the current supply of gold and the new supply mined each year. After all, gold doesn’t do anything (as it is unreactive) and an ounce of gold today will be exactly the same as an ounce of gold in twenty years.
When there is high uncertainty in markets and investors are fearful, they want to hold more of their capital in assets which they deem to be relatively safer. Despite the points we will highlight in this article, gold is seen as a safe haven asset. It is important to note that the word “safe” is subjective and is not the inverse of risk – it can have different meanings. For example, gold is safe in that it doesn’t react with the elements, and it is a physical and durable commodity, so as something you can hold it won’t change, and will store your value. Safe, however, doesn’t mean that the actual value stored in gold won’t change; that is to say, the price of gold does change and is inherently volatile.
Gold is often seen as a hedge to inflation, which is an empirically weak statement and looking at the historic data shows this. Gold’s real use is twofold, in my view.
First, it is an asset that in times of market stress an investor can put their money in and know that it won’t default. This is especially so when the stress is caused by geopolitical issues. When Russia invaded Ukraine in 2022, Russia was cut off from the SWIFT global payments system and many of its overseas assets were seized. The US also froze Russia’s US dollar assets so they could not use them.
Therefore, if central banks hold gold and not assets denominated in foreign currencies it is not possible for a third party to confiscate them – this holds true for investors holding foreign currencies or assets.
Its second use is not as an inflation hedge but rather a hedge for falling real interest rates – when nominal interest rates are falling or stable, and inflation is rising or high. This is different from rising inflation as in normal operations when inflation rises, central banks increase interest rates to slow growth and demand and bring inflation back down.
One of gold’s biggest weaknesses is that it is a non-yielding asset. Unlike your cash in the bank or your investment in a company, where you receive interest or a dividend, gold gives you nothing. So when interest rates rise the attractiveness of gold falls. We will see later on the impact of this lack of yield in the long term returns and the effect compounding has over time.
On the other hand, falling real interest rates – something we would see in a stagflationary environment – means that gold’s attractiveness increases.
If inflation is increasing while economic growth is slowing then one of two things could happen. The first is that the central bank can lower interest rates to increase economic growth (but risk increasing inflation further) or it can hold rates steady or increase them to pull inflation back down and damage economic growth (for an interesting read on this look at Fed Chair Paul Volcker and his actions during the late 1970s and 80s).
In this scenario the real yield on your bond or cash savings is falling because inflation is eroding your fixed returns (ignoring inflation linked securities which often move in the same direction to gold but has recently moved in the opposite direction). Equities may also be unattractive because of uncertainty in markets and lower demand from falling or stagnating growth. Therefore investors often view gold as a more attractive investment. Gold doesn’t have a fixed yield for inflation to erode and if the real return on other investments is falling, the opportunity cost of holding gold is lower.
You could argue the US is heading for a stagflationary environment, but other assets such as bonds are not pointing to that yet.
Types of gold investments and characteristics
Gold can be invested in through different vehicles, both directly and indirectly, each with their own characteristics and risk/return profiles.
Gold can be held physically in gold bars, coins or jewellery. It can be held through an Exchange Traded Fund (ETF) which tracks the price of gold and holds it physically without the investor having to hold it.
Gold exposure can also be gained by the use of derivatives such as futures, forwards and options contracts. Indirect exposure can be gained by investing in gold mining companies or gold related investment funds – this comes with its own additional risks, as you now have firm-specific risks (earnings, debt etc) and stock market sentiment risks.
There is also “digital gold”, where you own a fractional share of gold stored in a vault, and finally, there are now (for better or for worse) cryptocurrencies backed by gold.
Each of these ways of accessing gold have their advantages and disadvantages but the main two methods we are seeing used are the ETF method (primarily used by retail investors) and the physical method (used by both retail investors, central banks and institutional investors).
Liquidity can be a concern with gold and so too can costs of insurance and storage. While gold is tradeable in ETF form, which is fairly quick in terms of transaction times, liquidity also means looking at what price you can get for an asset. In a falling market investors will likely not get the ‘fair’ price they wanted for the asset. With a limited supply, it doesn’t take much to move the price of gold up or down.
A recent article published in the FT by Katie Martin on October 24th (link attached at bottom of article) also pointed out that to get onto the Royal Mint website to buy and sell gold related items such as gold coins, people had to wait in a long queue – not a liquid asset to sell if held physically. In the US people are queuing around the corner from shops to get in to buy physical gold.
Gold is held by a range of parties, with much of the news focusing on two main parties. The first being both developed and emerging central banks, who stepped up their buying in light of Russia’s invasion of Ukraine.
The second is the retail investor, whose access has been expanded by the use of ETFs.
Gold performance and the inflation-adjusted record
Gold does not produce a cashflow and so its intrinsic value is determined by supply and demand – enabling the price to go as high as investors want it to. This results in the risk of speculative bubbles forming and therefore large falls in value when investors’ preferences change, as there is no agreed-upon floor to the price.
Gold has continued to be the investor’s asset of choice this year, with the shiny gold metal rising 55.76% in US Dollar terms. We saw a pullback recently where the price fell by over 6%, but the price of gold remains high.
As a point to the inflation-hedging ineffectiveness of gold, some good old data. We use data as far back as we can easily obtain accurate figures for all our indices, which is 1989.
Some data is available back to the early 1980s which shows a worse return record for gold. We have used the S&P 500 as a proxy for equities and the LBMA Gold Bullion spot price per troy ounce. All returns are hedged back to sterling and our proxy for inflation is UK CPI.
I would also note that we can draw the same conclusions when looking at other equity indices such as the MSCI All Country World Index and even the FTSE 100. In my view, gold is a risky asset and so should be compared relative to other risky assets, not to safer bonds and cash (although we do comment on this below briefly). An allocation to a risky asset should come at the expense of another risky asset, not safer investments (all else being equal).
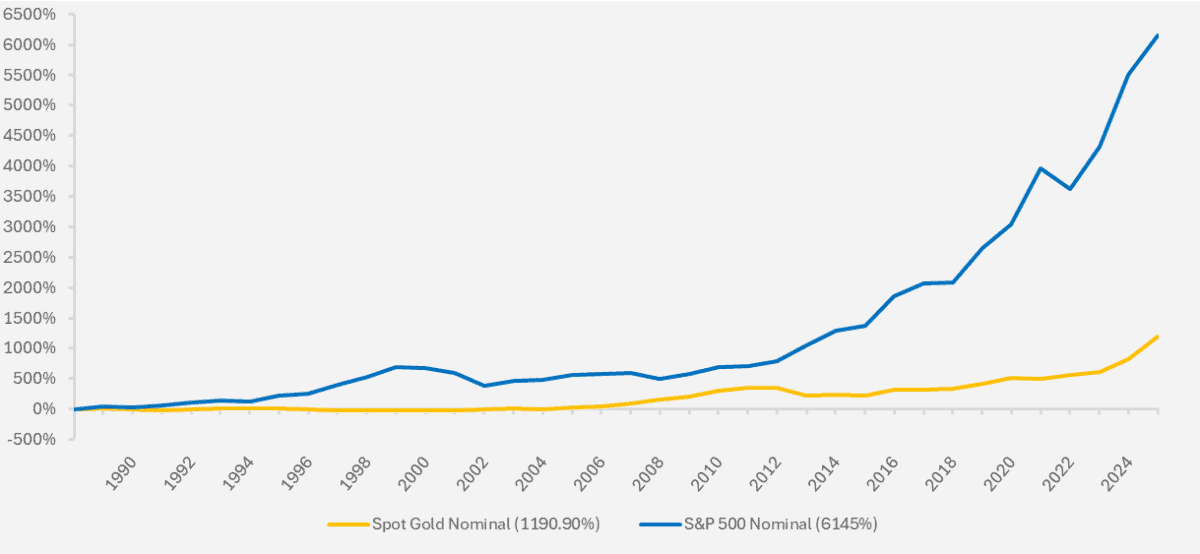
Chart showing performance of US equities and physical gold since 1989 (Source – Watson French with data from FE Analytics. All returns hedged back to GBP. S&P 500 index and LBMA Gold Bullion spot price per troy ounce used as US equity and physical gold proxies. All data is in nominal terms. Data correct as at 30.10.2025).
In nominal terms (that is, ignoring the effects of inflation) gold has returned a positive figure of 1,190%. Not too bad at face value, but if we look closer we can see why this may not actually be so good.
First of all, the glaring relative performance versus the S&P 500 index. Holding risky equities over this period would have yielded 4,955% more in return – that’s 11.19% a year on an annualised basis.
The second point, which is difficult to see on the chart due to the large gains made by the S&P 500, is that for most of the period between 1990 and 2004 holding gold would have given you a negative return. At the worst point in annual terms your gold investment would have lost 23.77%.
This is an extended period over which to hold a non-performing asset and the opportunity cost of doing so would have been huge, as we can see. From 2005 to 2012 returns picked up throughout the financial crisis but fell again significantly in 2012. From 2012 to 2018 returns ticked along before picking up more recently.
The point here is that to get a significant return you would have had to do one of two things. First you would need extremely precise market timing to get in and out at the right times, or second you would have had to hold gold for a very long time and suffered a long and expensive opportunity cost.
In my view, gold is a risky asset and comparisons to an equity index are fair. When we look at the annualised volatility of gold since the start of the data versus the S&P 500, gold has a volatility of 15.99% while the S&P 500’s is 15.53%, slightly less. With a higher return and lower volatility the S&P 500’s Sharpe ratio (a measure of risk-adjusted return, using the Bank of England Base Rate as a proxy for the risk-free rate) was 0.49 and gold’s was 0.19.
So, we have compared returns in nominal terms but the main point was that gold isn’t a good inflation hedge. This becomes more apparent looking at the real data below.
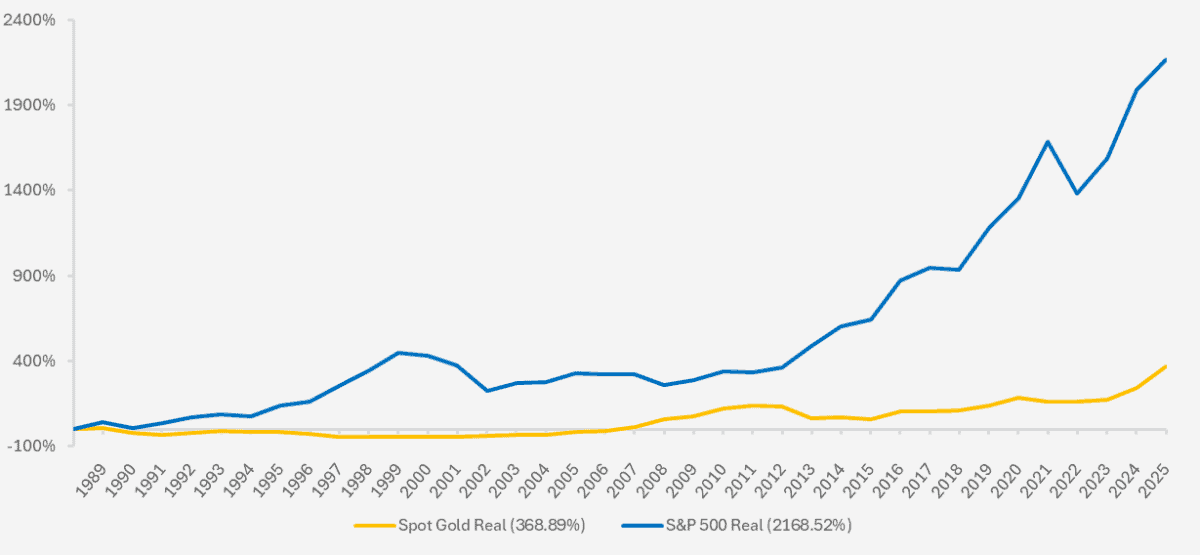
Chart showing performance of US equities and physical gold since 1989 (Source – Watson French with data from FE Analytics. All returns hedged back to GBP. S&P 500 index and LBMA Gold Bullion spot price per troy ounce used as US equity and physical gold proxy. All data is in real terms. Data correct as at 30.10.2025.
The chart above shows the same data but adjusted for inflation. At first glance it looks very similar to the previous chart, with the main difference being the final resulting return in brackets on the legend and the scale of the returns on the y-axis.
The end real return of gold looks pretty healthy as an absolute number, but in annualised terms this equates to a return of just 4.26% pa. Compare this to the nominal and real annualised Bank of England base rate of 4.04% and 1.33% respectively and the return doesn’t look great.
Again, it is difficult to show on the chart above the magnitude of the negative performance of gold in real terms, so I include the real return of gold in the chart below on its own.
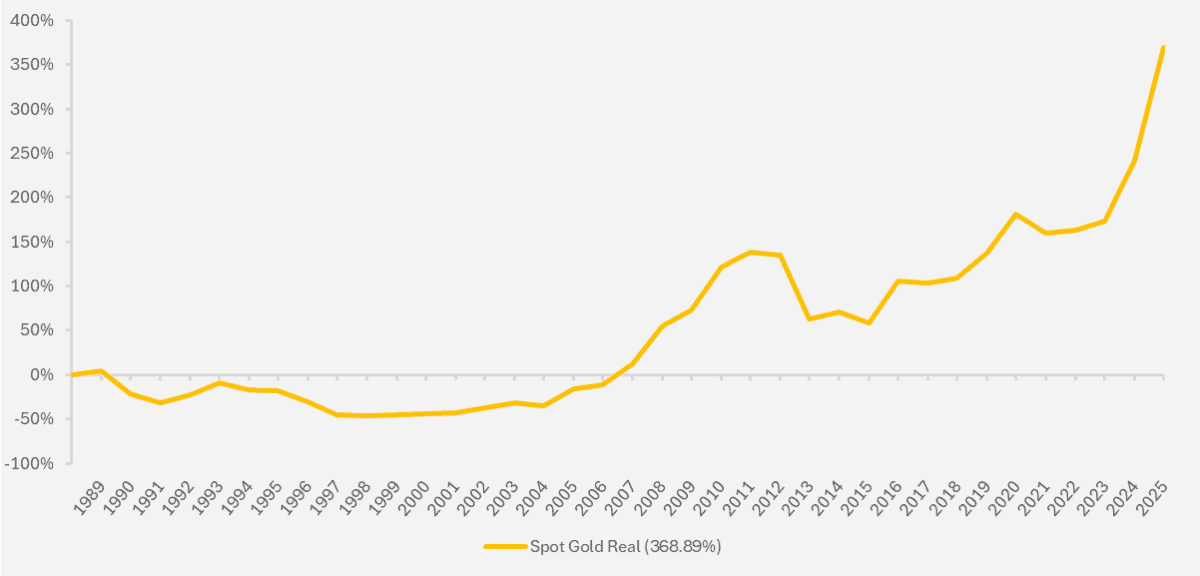
Chart showing performance of physical gold since 1989 (Source – Watson French with data from FE Analytics. All returns hedged back to GBP. LBMA Gold Bullion spot price per troy ounce used as physical gold proxy. All data is in real terms. Data correct as at 30.10.2025.
From 1990 to 2006 your real return in gold would have been negative, with the worst cumulative annual loss being as low as -46%. Gold had picked up from 2007 onwards but from there to where we are now we have seen several large corrections.
The main point to establish with the use of these charts is threefold.
The first point is to illustrate just how variable the price of gold can be. There can be very long periods where returns remain negative followed by quickly rising and subsequently falling markets. Timing is extremely important to get even some of the potential return on offer. This timing involves not just entering the position but exiting it as well. Being out by even a few months can result in a substantially lower return.
The second point is that there is a huge opportunity cost in holding a risky asset such as gold. We can see in the charts above that the S&P 500 held onto positive real returns for the majority of the period in question and this stems from both the capital growth in the index and the income that is paid out and reinvested. This is even more striking given that over this period we had the dot com bust, the 2008 Global Financial Crisis, the Eurozone debt crisis and the Covid pandemic, to name just a few major events.
Finally, the use of gold as a consistently effective inflation hedge is not reliable. There are long periods where your real return is negative and if you need your capital during this period you would be forced to realise a large inflation adjusted loss. As we keep repeating the price of gold is driven by demand and supply dynamics which are not influenced by measurable metrics such as earnings and the long term structural drivers (such as technological advancements for equities) which grow these earnings. You could be waiting a long time for your real return to turn positive.
You could argue that since 2007 gold has done fine and generated returns above inflation, but the historical record shows this has not always been the case and without consistency we are flying blind.
Why is this? We again reiterate that unlike gold, stocks have intrinsic value derived from the earnings they generate and the dividends they pay out. Over time any successful company needs to grow earnings and dividends above the rate of inflation, otherwise investors won’t invest in them and they will quickly go bankrupt. Over time, the compounding effect of these earnings can be huge.
As a long term hedge against inflation gold would not have served you well and instead, gold relies on an investor reading the current market well and making economic predictions in relation to economic data and geopolitical uncertainty, something that everyone is good at only in hindsight.
So why has gold moved so much higher this year? There are a number of theories being suggested, some short term and some long term. We start with the long term.
The main theory behind investors’ long term allocation to gold is the debasement trade. I say theory because not all the data matches up.
The debasement trade is based on investors’ trust in governments, central bank independence and the US Dollar all waning. Most of this stems from two main points – inflation and government borrowing. Investors who believe the debasement trade have the view that the market’s preference for holding US Dollar assets in times of stress and uncertainty is waning and for some, gold fills that space.
Inflation has been elevated for a while now and government borrowing has increased. Investors are fearful that governments will allow inflation to run hot in order to bring interest rates down and reduce their borrowing costs. This is called fiscal dominance, when a central bank steers monetary policy in the direction of government borrowing, not their given inflation target (or one could call this “fiscal insanity”). This matters because if inflation is already hot, lower borrowing costs will only intensify this and at some point something will break.
Investors are concerned that governments will choose their debt burdens over inflation and won’t make the hard choices, i.e. tax rises and spending constraints. Inflation is beneficial in that it inflates away debt – that is, if inflation is higher taxes should be higher and there will be more money to pay down debt. But this comes at the expense of a weak consumer. Once in play these things take a long time to rectify. Look at Japan for example, which has been on a decades-long fight to undo past policy mistakes.
Recent attacks on Fed independence also play into this debasement trade. The concern is that if the Fed is controlled by the President, it will no longer act independently and fiscal dominance will certainly take over.
Presidents do not like high interest rates (and especially Trump, who cut his teeth in the real estate market where they really do not like high interest rates) and in the event of a President-controlled Fed rates would fall and inflation would likely pick up.
One possible reason for the fall in the price of gold recently comes from the latest inflation data for September, where CPI ticked up by 0.1% on a monthly basis, but on a year on year basis remains at 3.0%. With a weaker labour market the Fed may continue with their rate cutting cycle, loosening the pressure Trump is putting on them and lessening the probability of a loss of Fed independence.
To sum this trade up, when investors are faced with uncertainty they turn to US Dollar assets such as US treasuries. If inflation is running hot and fiscal dominance takes over, inflation will eat away at treasuries’ fixed returns. Stocks will be lower in price because of a weaker consumer and so investors may not want to hold US assets. The alternative for investors could be gold in this scenario.
However, a shot across the stern for this theory is that since June the US dollar has moved sideways, not down. If this trade held true, we should be seeing more depreciation in the US Dollar but we are not.
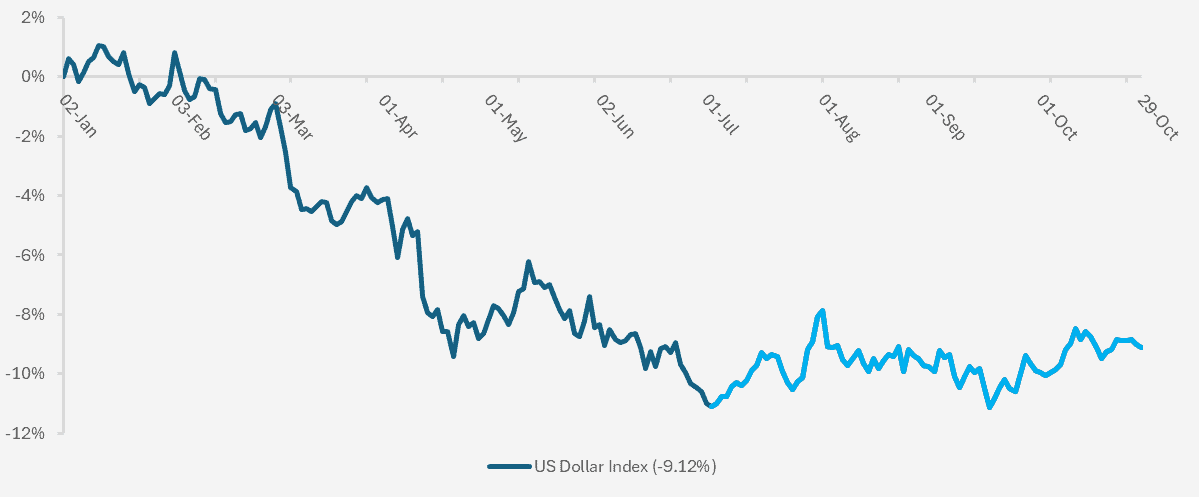
Chart showing the YTD cumulative change in the US Dollar Index (Source Watson French with data from Investing.com. The light blue line highlights the performance since the July low. Data correct as at 29.10.2025).
Another one is the behaviour of the US treasury yields. If we were seeing the debasement trade playing out then yields would be moving higher, but we have not really seen this. Granted yields are higher than they have been relative to the past decade, but this is explained by the normalisation in interest rates. If investors truly believed the US will inflate their way out of debt then yields would be much higher.
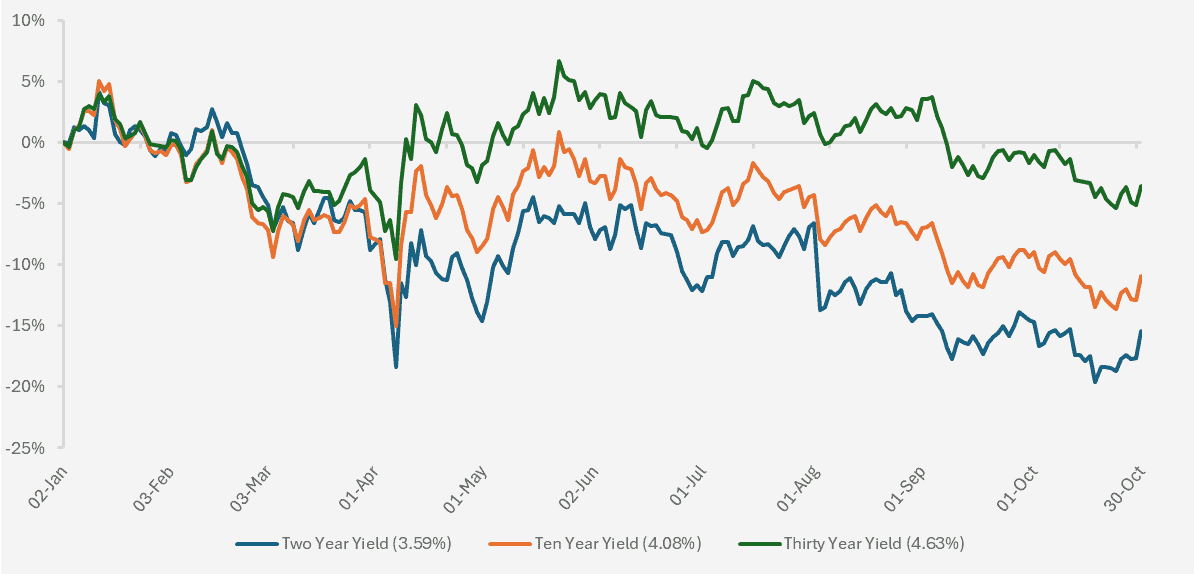
Chart showing the YTD cumulative change in the two, ten and thirty year US Treasury yields (Source Watson French with data from Investing.com. Data correct as at 30.10.2025. Data in brackets in legend shows latest actual yield).
As we can see this year yields across the maturity range have actually fallen. They ticked up during the April “Liberation Day” tariff announcements and have slowly moved back down. Even the thirty-year yield, which globally has picked up over debt sustainability concerns, has fallen somewhat. As US Treasury Secretary Scott Bessent recently said ‘where the hell is the risk in markets’.
We could argue that we should be looking globally and not just at the US dollar, but again this argument doesn’t hold much weight.
We see the debasement trade as a good theory but not the driver of gold.
I think a large number of reasons are all contributing to gold’s rise, but one short term and inevitable reason has taken over.
Gold is useful for emerging markets’ central banks as an alternative to US dollar assets. If they reduce their reliance on holding such assets their economies won’t be so influenced by US actions. Gold is held as protection from the potential for US assets to be frozen.
Gold’s short term rise is easily explained and in my view, the simplest and most logical explanation is the momentum trade. The rise in gold started out because of central bank and emerging market reasons, as detailed above, but it has now been driven by momentum with retail investors buying into gold ETFs at volume and consumers queuing physically and virtually to buy physical gold, likely due to the fear of missing out.
When sentiment and markets change we will see changes in investors’ attitudes to gold and over the long term we cannot advocate a place for gold over real assets, which have both capital growth and yield properties, because of the tactical nature of gold and its shaky intrinsic value estimates.
Outlook and thoughts on gold
We are seeing institutional investors increasingly advocating a place for gold in the strategic asset allocation of portfolios. Prior to the last two years we didn’t see this because the price of gold hadn’t risen. Only now the price has shot up and the momentum is high are we seeing the increased sales tactics to buy gold.
This further cements some of the short-termism, momentum driven trades and Fear of Missing Out (FOMO) that we are seeing in markets. Those institutions who hold gold and have a foot in needing gold to stay at high prices have a reason to sell it to others; those that don’t hold gold have a need to stay rational and not give in to our FOMO. The same rationale applies to private markets – institutional investors need someone to buy their private assets off them and realise the returns they want, but the retail investor will only then receive whatever is left over.
This information asymmetry is very strongly felt in illiquid and private markets and another place we have historically seen this is in special purpose acquisition vehicles (SPACs).
The price of gold could come back down if a hawkish Federal Reserve Chair is elected next year and prioritises inflation over economic growth. In this environment we could expect to see inflation fall back to 2% targets with interest rates remaining higher. Alternatively if we see interest rates falling but also inflation falling back to target and growth moderating but not slowing too much, the relative attractiveness of gold will wane. Couple this with a continuation of earnings growth in AI-related companies and a steady stream of private market listings and gold may not be at the top of investors’ asset allocations.
On the other hand, an uptick in inflation and a Fed which presses ahead with rate cuts will likely support the price of gold in the short term.
Our general view on gold is that it doesn’t belong in a strategic asset allocation. It is notoriously difficult to predict what gold will do and as its intrinsic value is not derived from relatively easily measured cashflows, this makes it unsuitable to continuously hold for the long term. Past data has shown both periods of strong gold performance, but more so incredibly weak real gold performance depending on when it was invested in. We see gold as a tactical play and prefer to invest into real assets with characteristics that make them suitable for a long term allocation.
Risk needs to be rewarded when investing in assets, and gold’s record of risk-adjusted returns over the long term is relatively poor.
One reason we are cautious on the price of gold is that the price of silver has also shot up this year. Silver is not as attractive as gold for a store of value as it is more heavily used for industrial purposes and prices are more influenced by this. Although a precious metal, silver is more reactive than gold and gold is seen as more luxurious. Therefore silver should be influenced mainly by industrial uses and with a slowing global economy, it should not have moved to the extent it has.
Link to Katie Martin’s FT article on gold (note FT subscription required) – https://www.ft.com/content/56055035-7034-4b3f-80df-1f0b964d3265
Robert Dougherty, Investment Specialist
October 2025
This article is not a recommendation to invest and should not be construed as advice. This document has been produced for information purposes only. The value of an investment and the income received from it can go down as well as up, and you may get less back than you invested. Data is correct at time of writing and cannot be guaranteed.