3rd November 2025
October has been an eventful month, with markets wobbling at times but continuing to push upwards. Risks are elevated but earnings are growing strongly and market optimism is high. When we say risks are elevated, this doesn’t mean that we expect a market correction – it just means there are developments to be aware of that may cause shorter term volatility and should be borne in mind when setting longer-term expectations. As we can see in the summary year to date chart below, nearly all of the major asset classes are at their YTD and also all-time highs.
Japan elected its first female Prime Minister in Sanae Takaichi, the French Prime Minister Sébastien Lecornu resigned after just 26 days in office before being reappointed, the US government shutdown continues with no end in sight, we have seen credit risks increase in the US with the default of two US companies, talks of bubbles are everywhere, speculation over the UK Budget continues and Argentinian President Javier Milei strengthened his party’s position in government, helping to ensure he can continue his chainsaw-wielding free market reforms for his remaining two years in office. Not to forget gold, which continued its strong run for the year.
A lot of narratives and risks here but markets continue to remain strong and so (as always, we look for opportunities in this article make this point) we should not react and change a long term strategy for short term headlines. We look for the change in long term structural drivers, while remaining aware of short term risks and how they are developing.
I recently ran the question of how many minor and major systematic events (those that affect markets in general rather, than one specific company) have there been in the last decade that negatively affected markets through Microsoft Copilot, and the number is quite surprising. In terms of major events we have seen an estimated 30 – 40, and for minor events we have seen between 220 – 260 (there is a range depending on how you define the parameters). This is huge, and we often forget that what we see each year has usually happened in previous years – we just have forgotten.
We refer to this as recall bias and this is another one of the psychological behavioural biases which are defining markets today.
Sanae Takaichi was elected internally as leader of the ruling LDP party in Japan. Takaichi is a fiscal and monetary dove and markets expect her to put pressure on the Bank of Japan to keep interest rates low. Markets have reacted positively to this election but there are concerns over how her policy will impact inflation and the health of the consumers. We look more at this later in this article.
Longer term optimism remains however, with the key structural driver of corporate reforms continuing to play out.
France continues to be weighed down by an inability for the government to agree on a path to fiscal sustainability. Equity markets shrugged this off, with the Euronext France CAC 40 returning 5.41% over the last month. Smaller companies struggled relatively more with a drawdown of over four percent. Domestic companies look to be more at risk than overseas focused companies, but as we recently saw, the threats to tax the biggest French companies (such as that directed at LVMH) are a risk factor that will weight on valuations. Investors are watching France to learn any appropriate lessons given the rise in global government debt.
The US government shutdown has continued throughout October, with all non-essential workers not working and also not being paid. The main impact we are seeing is the lack of economically sensitive data releases, which both markets and the Fed use price assets and set interest rates.
We did get the latest US inflation data for September with CPI increasing from 2.9% to 3.0%, but below expectations. The Fed cut rates by 25bp at their meeting on Wednesday but stern words from chair Powell put a December rate cut, which was previously nailed on, into more doubt.
Everywhere you read the word “bubble” pops up. Is the AI technology market in a bubble, is the quantum computing sector in a bubble, is gold in a bubble? Valuations are high and so are future expectations. Markets love to climb a wall of worry but investors keep making this wall lower, allowing valuations to climb. The introduction of the retail investor in recent years has kept valuations high, with momentum trades carrying on for longer and stronger than ever.
We see the potential for AI to be revolutionary and productivity-enhancing but as pointed out in our last commentary, we also see the risks. Therefore scenario planning in markets today is important, positioning portfolios for a variety of scenarios and not just the continuation of the present one.
Lastly, Gold prices fell towards the end of the month at the same time as US-Chinese relations looked to be improving. Possibly it was this news or perhaps it was profit-taking that pulled the price down. We look at gold and its uses in a portfolio in a separate article.
–
Areas of focus
- Technology valuations on aggregate remain high, but we see much variance among individual companies. Nvidia for example continues to make deals and solidify itself as the centrepiece of the technological boom.
- We see divergence in the performance of growth and value companies globally – in the US growth companies have outperformed but in Europe and Japan value companies outperform.
- Similar to the pickup from the bottom of the Covid drawdown, low quality and unprofitable companies are leading the rally from the April Liberation Day market drop. Like the Covid rally we see this ‘junk’ rally as unsustainable.
- Gold and silver have seen pullbacks towards the end of the month but the gold trade remains popular among institutions and retail investors.
- In a more niche area of the finance world, with the recent hurricane hitting Jamaica, investors in a Jamaican catastrophe bond are facing large losses.
- US high yield bond spreads picked up at the start of October over fears of higher than expected credit risks in the market. Markets decided this was a non-systematic risk and yields came back down.
- Private credit continues to be an opaque but growing corner of the market. With suspect credit ratings, information asymmetries and more connections to the traditional banking sector than it may seem, investors should be cautious of an increase in systematic risk stemming from AI capital expenditure debt needs and a slowing economy.
- UK long and short term gilt yields have fallen as markets price a greater probability of more interest rate cuts this year.
- South Korean equities have had a strong year, with the MSCI Korea index rising 72.84% in pounds sterling terms. The index is technology heavy with Samsung Electronics and SK Hynix accounting for 26.59% and 12.70% of the index respectively.
–
Asset Class Returns
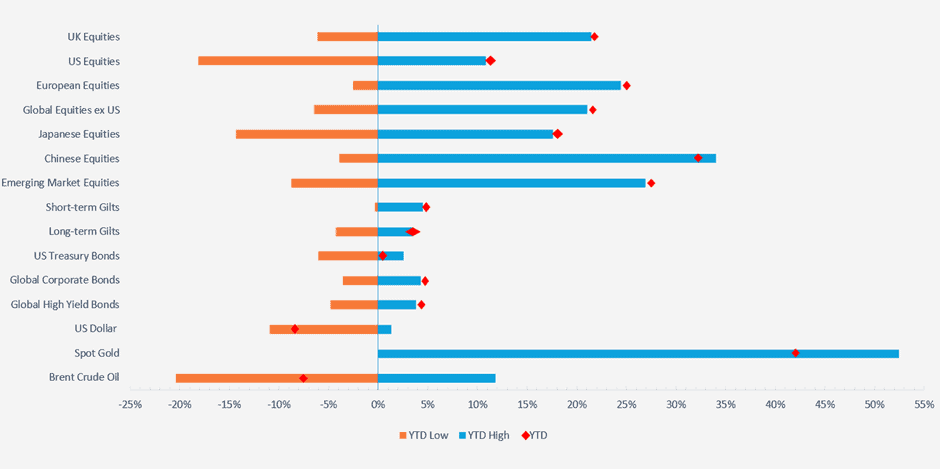
Selection of assets 2025 YTD returns and range of returns as at 30/10/2025 (the two ends of the bars represent the range of YTD returns and the red dots represent the current YTD return). Indexes used: FTSE All-Share, Russell 2000, STOXX Europe 600, MSCI World ex USA, MSCI Japan, MSCI China, MSCI Emerging Markets, FTSE UK Conventional Up To 5 Years, FTSE UK Conventional Over 15 Years, ICE BOFA US Treasury, ICE BOFA Global Corporate, ICE BOFA Global High Yield, US Dollar Index, S&P GSCI Gold Spot & S&P GSCI Brent Crude Spot. Returns hedged back to GBP with exception of US Dollar which is in US Dollar terms. Returns based on daily data. Source – Watson French with data from FE Analytics and MarketWatch. Data correct as at 30.10.2025.
–
US
The US economy remains in a fragile balance – recent inflation data showed a small uptick in September from 2.9% to 2.0% but still below market forecasts. Meanwhile with the US government shutdown ongoing we have been unable to get any concrete labour market data. Economists like to say the US economy is in a no hiring, no firing state, but when we read company headlines we see that the economy is very much moving to a firing state, as businesses look to cut costs and automate what they can.
Amazon, for example, is looking to lay off 30,000 employees. It may be more correct to say we are moving into a firing, only-hiring-if-AI-cannot-do-it labour market. More managers in companies are having to justify why they need to hire a new employee over automating the process with AI.
The lower supply of labour due to immigration and AI has meant the US economy has not needed to add as many jobs each month to keep the unemployment rate low – by that same logic the economy doesn’t need to shed too many jobs to push the unemployment rate up.
If the labour market deteriorates we should expect the Fed to increase their pace of rate cuts. On the one hand this a positive for companies, but on the other hand if GDP growth slows too much we will start to see a drag on revenues. Powell’s recent comments put this into doubt however.
The US government shutdown tends to detract from GDP in the short term as government employees don’t get their pay checks and so cannot spend as they usually do, and government contractors also don’t get paid. When the government reopens this usually reverses, and we see a corresponding uptick in GDP – hence markets are not too concerned about this aspect of the shutdown.
US equity markets continued their push higher this month. We did see value stocks in the S&P 500 perform in line with growth stocks (while underperforming YTD overall) as investors increased their allocations to defensive sectors such as consumer staples. With a strong start to Q3 earnings season investors have remained bullish across the board.
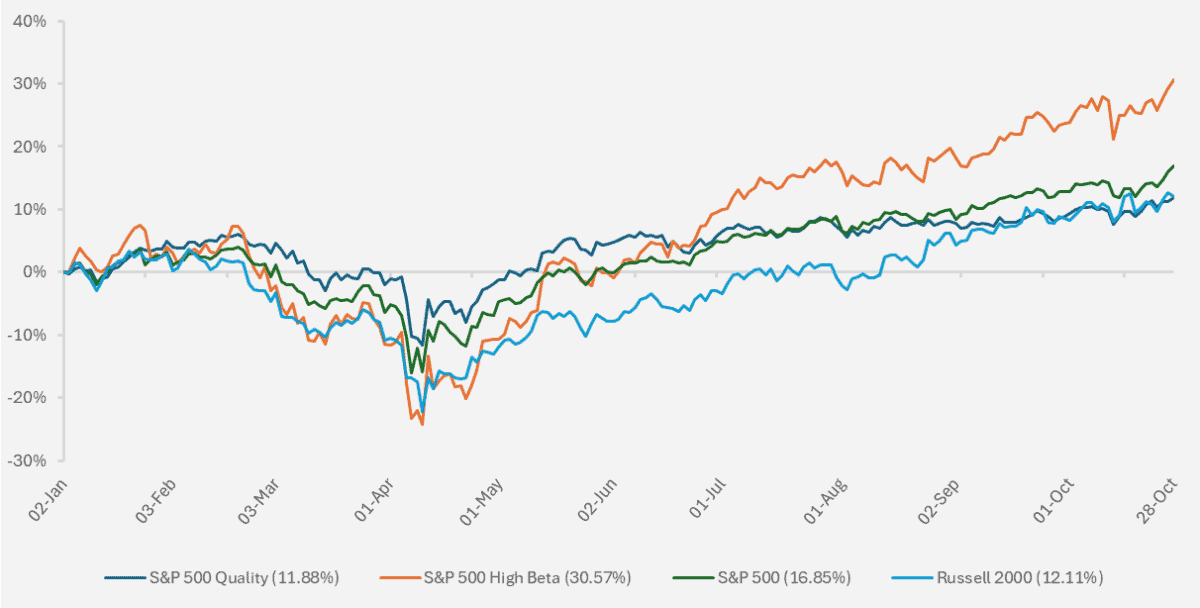
Chart showing YTD performance of various US equity indices and sub-indices (Source – Watson French with data from Financial Times/LSEG. Returns in USD. Data based on daily opening prices. Data correct as at 28.10.2025).
The junk rally in US equities continues with highly unprofitable companies in highly speculative areas such as quantum computing leading the gains, while quality companies with high returns on equity have lagged. Bubble or not, we see the biggest risks for a drawdown in these high beta (high sensitivity to moves in the market) stocks (see chart above for YTD performance of high beta S&P 500 companies). Rallies in junk stocks are unsustainable over the long term and mean reversion will bring valuations in line with earnings eventually.
We saw further circularity in the AI space with OpenAI making deals with everyone they can find, and we also saw more potential government intervention in private sector companies as the government looked to invest in quantum computing companies.
Despite the risks posed by this circularity we do see less risk outside of the popular large language model space. Nvidia, for example, continues to solidify itself as a key player with recent headlines showing deals with non-technology companies such as Eli Lilly for commercial use cases. We also see companies other than OpenAI making potential headway in the space. Anthropic for example has focused its product line more on business use rather than the retail chat bots and is gaining an increase share of the market.
OpenAI may be the poster child for the AI technology boom but there are lots of opportunities for the active investor in the market. Companies that are more focused may find greater growth opportunities than those trying to appeal to everyone. Again, there are always risks in the short term when we see equity valuations at record highs but over the longer term the potential returns in the AI space spread a lot further than the hyper-scalers and data centre builders.
One area we do see high levels of risk is in energy companies in the US. Their share prices have rocketed this year, especially in the nuclear energy sector, as the expected demand for electricity keeps on growing and thus their future earnings expectations increase. We will ultimately see improvements in the energy efficiency of data centres and AI models over time and if this happens sooner rather than later, or if we see a balance sheet recession as the volume of data centres is deemed unnecessary, energy company future earnings may not materialise.
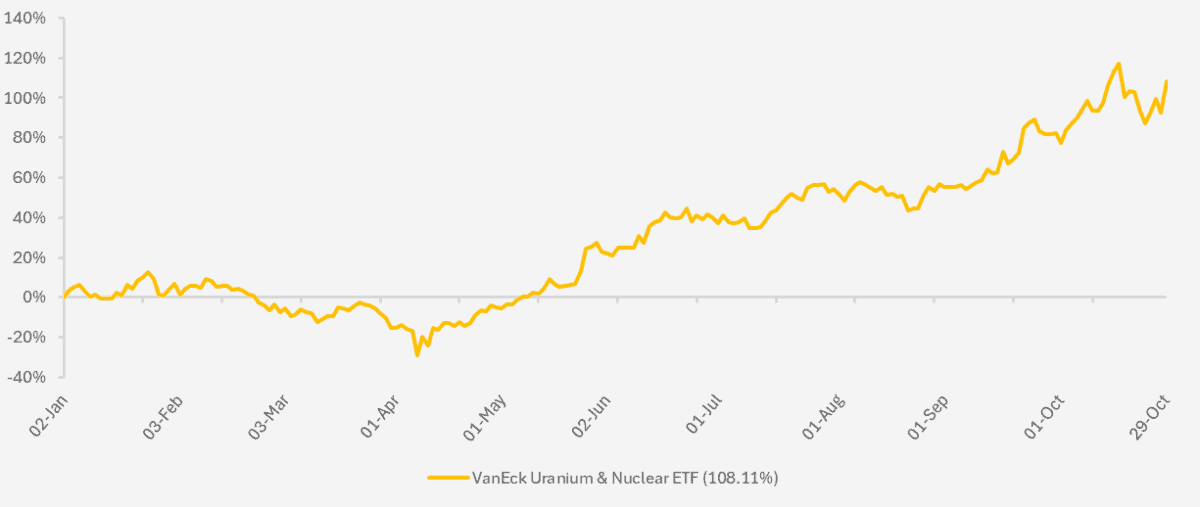
Chart showing the YTD performance of the VanEck Uranium & Nuclear ETF. (Source – Watson French with data from Financial Times/LSEG. Returns in US Dollars. Data based on daily opening prices. Data correct as at 29.10.2025. This ETF tracks the MarketVector™ Global Uranium and Nuclear Energy Infrastructure Index and is used in this case to represent a proxy of the performance of the Uranium and nuclear energy sector. It is not a recommendation to invest in this fund and actual performance of the index may differ from the performance of the fund).
Momentum continues to remain strong in equity markets, especially US growth markets and one force helping this is the retail investor.
Commission-free investing has become so accessible for investors now that anyone can invest in stock markets, using readily available leverage to amplify any gains (and losses!). Investing and trading are two separate games, and what we see at the moment in the junk stocks is trading. We noted in a previous commentary that research showed the retail investor spent just six minutes researching a stock before investing. Therefore it is fair to say that much fundamental analysis goes out the window on this basis. With a higher proportion of wealth in the US invested in the stock market compared to the UK, where wealth tends to be held in cash, we see high risks for retail investors’ financial positions in junk stocks.
A more interesting point to look at is the role of short sellers in the market. Bond markets are huge – bigger than equity markets and more difficult for the retail investor to trade in. This makes it easier for bond vigilantes to short sell bonds and drive up yields when they don’t like what they are seeing in the economy. One would argue this helps to keep bond markets, economies (and Liz Truss wannabes) in check.
But we don’t see this so much in equity markets. Hedge funds who use short selling as a strategy to target weak and overpriced stocks have not been able to generate the returns they used to, and consequently this strategy has lost its appeal. Again we look to the retail investor as the reason behind this.
Social media platforms such as Reddit forums help to funnel investors into stocks and squeeze out short sellers, driving the price of so-called “meme stocks” upwards and forcing them to cut their positions. This group behaviour is very dangerous for short sellers and has led to many previous short sellers stepping aside.
Compounding this problem is European (and currently UK) legislation which means that short sellers have to publicly disclose their identities when their stakes move above a certain percentage threshold.
Short sellers have been a part of well-functioning markets (debatable in some respects, but if we believe markets are somewhat efficient then this is important), driving the price down in poor companies and thus allowing capital to be allocated to better performers. With the risk of being short-squeezed and with financing costs higher, the short seller cannot perform their role in policing financial markets.
Retail investors also love leverage and derivatives, and these factors combined have added to the risk we see in markets.
Absent this, we still see fundamentals as strong but a lot of risk remains in the system in more speculative areas of the market.
Finally, private credit. This month we saw First Brands (an auto part supplier) and Tricolor (a subprime auto lender) collapse and default on a large amount of private credit obligations. Investors in Tricolor’s debt claimed fraudulent activity as billions of dollars just seemed to vanish.
This fraudulent activity in lending tends to pick up in the late stages of a cycle as market participants get greedy and issuers use extensive debt to grow and keep up with the rest of the party.
Corporate spreads initially picked up following these events. Despite these failures however, the market has brushed them off as firm-specific problems rather than wider and more problematic systemic wide risks. As Jamie Dimon, CEO of JP Morgan put it: “when you see one cockroach there are probably more”.
Whether or not this is the case here, these events do give pause for thought on what is termed the non-depository financial institutions sector (NDFIs). NDFIs are responsible for all of the growth in US bank lending over the last year. They do not have deposits from savers from which they can then lend to companies, and instead rely on investment and bank financing to create lending to private companies. Because they are not deposit takers they are not subject to the onerous regulation that traditional banks are subject to, and can therefore engage in a wider range of activity and lend to more risky companies.
The kicker is that they still rely on lending from traditional banks and therefore, while banks may not be a primary connection to these private credit firms, they do still have some sort of connection. The Bank of England, the Financial Conduct Authority and various other global regulators and financial bodies have pointed out recently the risk that stems from not being able to accurately gauge where the risk lies and which parties are connected.
Deposit takers in banks should be protected from any losses stemming from supposedly unrelated defaults in private credit markets, but the complex web of lending and asset-backed financing makes it difficult to see where the buck stops.
Furthermore, this private credit is often rated by a credit rating agency, but only the issuer and select investors are allowed to see the rating. An increasing share of smaller credit rating firms are providing these ratings and according to the Bank for International Settlements, the ratings have been inflated. Research by the National Association of Insurance Commissioners showed that they estimate small credit rating agencies gave ratings three notches higher than their assessment of the rating.
As a case in point, some Tricolor debt was rated AAA (the highest rating) before the firm collapsed. With assets and money missing these investors lost much of their protection.
As mentioned, this may well be a case of two poorly-run firms defaulting but it does highlight how opaque the private credit world is, and why it is and should be its own asset class reserved for institutional investors, not retail investors.
–
UK
This won’t come as a surprise to many but the UK stock market took another beating as AstraZeneca, the biggest company in the UK stock market, opted to list its main shares on the New York Stock Exchange and leave trading in the UK to depository receipts (which are similar to shares but which have different characteristics, such as no option to take up rights issues).
At a time when the UK government is looking to raise cash to meet its spending and debt needs this is a big blow. Unlike shares, depository receipts do not incur stamp duty on trading. Estimates put the loss to stamp duty at £200 million a year.
The UK is one of the few major stock markets in which tax is charged on trading. There is a fine balance here; reducing or removing the stamp duty makes the UK a more attractive market to list and trade on, but at the same time it will further hurt the tax receipts for the UK government.
Inflation in the UK remained steady at 3.8% with services inflation also remaining at 4.7%. Both of these figures were below the Bank of England’s and market’s expectations, prompting expectations for another interest rate cut this year to move upwards. Some reports put the probability of a December rate cut at 60%.
Although the details of the Budget will remain unknown until Budget day itself, we could see a lower inflation picture affect this in two ways.
Firstly, it could prompt the chancellor to push ahead with tax increases, the thinking being that if inflation is slowing the effect of a tax increase will be felt less on consumers’ pockets. Second (and opposite to the first point) if inflation is slowing then there may be further interest rate cuts, lowering the government’s borrowing cost and opening up the possibility of less need for tax increases and spending cuts.
With the Budget next month the effect on markets will mostly be indirect on the equity front, certainly for bigger companies which are less domestically-focused. The real effect will be on the bond markets and this effect will likely then spill over into equities.
Markets want to see fiscal constraint and this means the unpopular tax rises or spending cuts. The reason for is that the government can raise (or free up) money in the short term in three ways – taxes, spending cuts and borrowing.
The government’s borrowing is already high – interest on this debt is therefore at high levels, which the markets see as unsustainable. Therefore further borrowing is not on the cards. The government has tried and failed to cut spending as its own party voted to not allow it. This leaves tax rises.
The Office for Budget Responsibility is expected to downgrade its growth forecasts for the UK economy and this means a widening fiscal deficit. Less growth means less taxes.
If markets don’t like what Rachel Reeves puts out (which, it is worth noting, is different to how any other country does its budget – in other countries there is no voting on the fiscal measures when a party has a majority) bond yields will rise.
Higher bond yields increase the cost of borrowing for the government and for businesses. This also affects equities, as government bond yields are used as the discount rate input for equity valuations – higher discount rates translate to lower valuations. As mentioned, they also increase the cost of borrowing for businesses.
Furthermore, we need to look at the currency market to see the effect there. A higher bond yield means that there is less demand for bonds and so the price falls, as there are more sellers than buyers.
Depending on who is selling, this could put downward pressure on the currency, causing a weaker pound. However, it also depends on what other countries are doing. If the US Federal Reserve is cutting interest rates and their bond yields are falling, we may see a preference for higher UK bond yields and so a strengthening pound.
As you can see the outcome is complicated and more dependent on external factors than just the UK budget decisions.
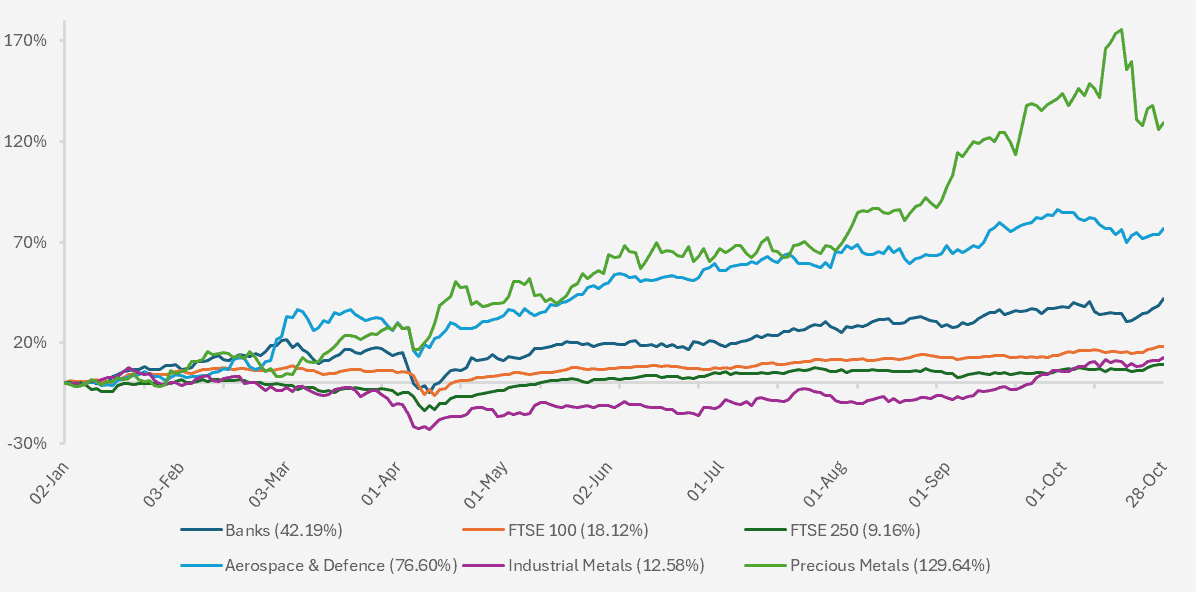
Chart showing YTD performance of various UK equity indices and sub-indices (Source – Watson French with data from Financial Times/LSEG & Investing.com. Returns in GBP. Data based on daily opening prices. Data correct as at 28.10.2025).
UK equity performance remains strong for the year, driven higher by more traditional industries such as mining and banking. While the UK economy may be slow, the stock market is doing just fine in the larger cap space.
The FTSE 250 and other smaller companies continue to struggle with higher financing and taxation costs and an active approach is again important to find the winners in the UK market. The precious metals sector (which includes mining companies) has had strong performance this year.
Gold mining companies are another way of gaining exposure to the yellow metal but unlike pure exposure to gold, exposure through mining company shares brings stock-specific risks and arguably more risk. This is reflected in mining companies’ stronger performance this year versus the metal itself. This also brings the risk of larger drawdowns should the price of gold fall.
The industrial metals sector, which includes metals such as copper and lithium, has not performed as well and has spent most of the year in the red. This sector is more heavily influenced by global growth and in particular this year trade negotiations.
–
Japan
Sanae Takaichi’s first meeting with President Trump seemed to go well, with Trump being gifted golden golf balls and calling Takaichi ‘beautiful’. This builds the possibility for a better trading relationship between the two countries, but Takaichi and her policies may well provoke aggression for her Asia Pacific neighbours, specifically China.
We see risks from Japan’s new Prime Minister and her dovish stance on monetary and fiscal policy. Her belief is that the Bank of Japan should not raise interest rates any further and consumption tax should be slashed. Instead, excess tax revenues and government borrowing should be used to combat Japan’s increasing inflation problem.
In our view there are risks to this approach, as it may well prove to be inflationary. Increased government borrowing will result in a rising yield curve, especially at the long end.
A combination of increased bond yields and increased borrowing will increase the government’s interest costs. Lower taxes and increased spending will also be inflationary.
The effect on the currency in this scenario would be a weaker Yen. This is a positive for Japanese exporting companies but a negative for the Japanese consumer, as imports will be more expensive. Trump may also see this as currency manipulation and similar to Switzerland, take action via higher tariffs.
The Yen has weakened versus the pound over the past month by just over 1.7%, and YTD by 2.8%. This has resulted in a drag on sterling investors’ returns in Japanese equities. We can see in the chart below, which shows that following the Nikkei 225’s April bottom, performance has been very strong with returns of over 46% since then. Most of this has come from knowing where Japan sits with the US on tariffs and the long-term structural theme of corporate reforms in Japan.
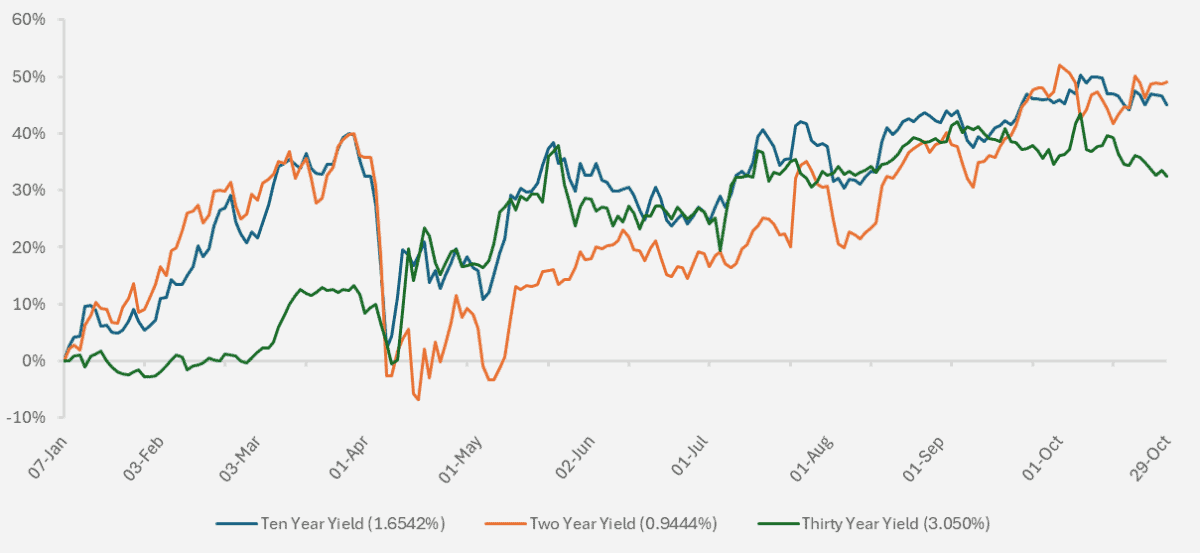
Chart showing YTD cumulative change of two, ten and thirty year Japanese government bond yields (Source – Watson French with data from Investing.com. Data based on daily opening prices. Data in brackets shows latest current yield for each maturity. Data correct as at 28.10.2025).
We can see the huge rise in Japanese government bond yields this year as Japanese interest rates have increased from -0.10% (where they sat for over eight straight years) to a current rate of 0.50%. Year on year (yoy) CPI inflation in Japan was 2.9% in September, down from the previous month and slightly lower than the yoy rates from earlier in 2025.
Japan is engaging in a very fine balancing act. After years of battling deflation and negative interest rates the Bank of Japan is attempting to normalise the system. Pressure from a dovish Prime Minister could send this off kilter and ruin decades of work. The result – high inflation and a poorer consumer.
If her plan works however it could spur on growth. We see this as unlikely and not in keeping with how economies work.
Value stocks have continued to benefit more than growth stocks in Japan as value stocks are where the corporate reforms are having their main impacts. We still see a blended approach as the best exposure for Japan as the growth industry includes world-leading robotics and AI companies. For example, Japanese companies can make the most precise machining tools in the world and no other country can come close to this precision. In this technological transformation, factors like this are extremely important.
We see banks as potential laggards under the new Prime Minister’s regime if interest rates are kept low.
The Japanese market has a huge volume of traded companies and so opportunities for active investors. In the US at the end of 2024 there were just over 4,000 listed companies. In Japan there are now just under 4,000.
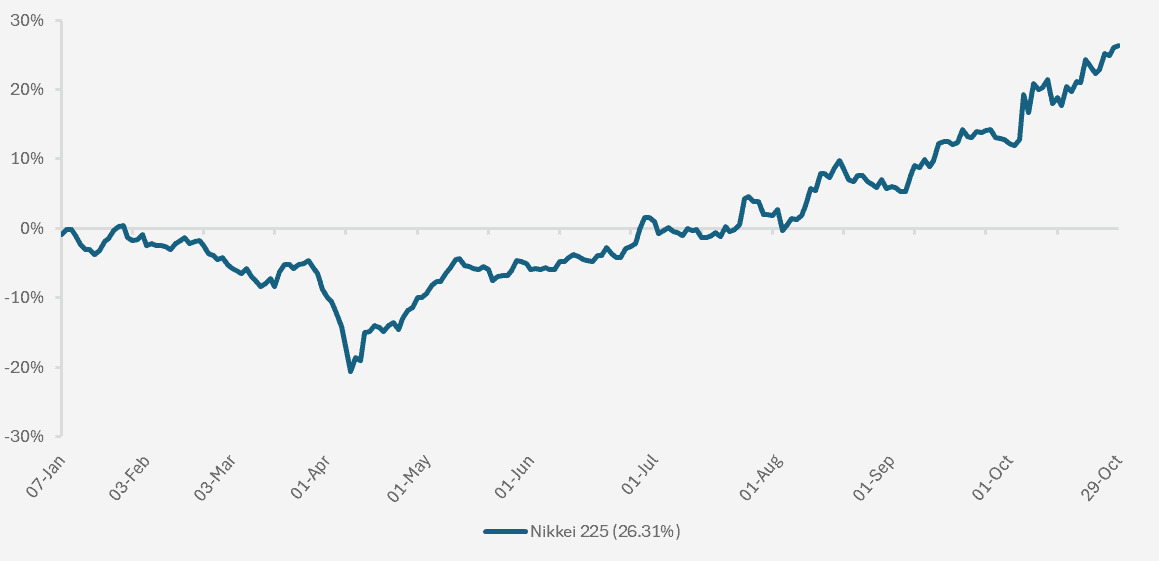
Chart showing YTD performance of the Nikkei 225 Japan equity index (Source – Watson French with data from Investing.com. Returns in Japanese Yen. Data based on daily opening prices. Data correct as at 28.10.2025).
–
Robert Dougherty, Investment Specialist
November 2025
This article is not a recommendation to invest and should not be construed as advice. The value of an investment can go down as well as up, and you may get less back than you invested. Data is correct at time of writing and cannot be guaranteed.