1st December 2025
It could just be profit taking from risky assets as we approach the year’s end and large hedge fund managers look to protect the profits they have made to keep their big Christmas bonuses, and from retail traders (which have accounted for 30% of trading volume in the S&P 500 this year).
Recently popularised US tech stocks such as Oracle saw large drops in value as future growth and funding concerns started to creep in. Investors may be seeing the risks in AI infrastructure spending starting to become more systematic as these companies move from financing expansions with cashflows to financing them with debt – and in so doing spreading risk throughout the system.
We continue to see markets talk about an AI bubble but upwards momentum is still keeping the market high. The probability of a correction in 2026 is increasing with markets pulling back, but much will depend on the direction of the US economy and the spending of the biggest technology companies.
We saw continued speculation throughout November over the UK Budget and when it eventually came it was disappointing to say the least. Spending was frontloaded and tax rises backloaded with commentators claiming it was taxation to fund “benefits street”. The main issue we see is that there is no incentive for businesses to invest and until this changes, growth will remain stagnant.
UK equities saw inflows from foreign investors, but UK investors represented a net outflow for this month. We do not see recently proposed ISA changes affecting the sentiment for UK equities from domestic UK investors in any way. Banks however continue to perform well in the higher interest rate environment.
Japanese government bond yields rose in November as the new Prime Minister Sanae Takaichi brought out a new stimulus package worth over $135 billion. Markets continue to tread with caution over how this package will be financed and how much new debt will need to be issued. Pressure is on the Bank of Japan to keep interest rates low and favourable. Coupled with a new spending package and a weakening Yen and we could see inflation move higher and with the potential for it to become unanchored.
Global emerging markets lost value over the past month along with the broader market. Over the course of this year they have still performed strongly, driven by a weaker US Dollar and country-specific performance, such as South Korea. We continue to see value in emerging markets but acknowledge they are starting to trade on the expensive side relative to their historic average valuations. Risks may be skewed to the downside with heavy exposure to AI spending.
–
Areas of focus
- In the US, defensive sectors such as Consumer Staples and Healthcare have outperformed the sensitive technology sector over the past few weeks but continue to underperform throughout 2025 as whole.
- The US Dollar has strengthened over the past month, potentially halting its large decline this year. End of the US Dollar? We don’t think so, certainly given the recent volatility and losses in ‘modern’ cryptocurrencies.
- An equal weighted S&P 500 index has continued to lag the market cap weighted index this year. Investors look to the equal weight index as a hedge but in a falling market it may not offer much protection.
- Following the Budget, UK two year Gilts remained flat with the ten year Gilt trading slightly lower. The pound moved higher versus the US Dollar as the probability of UK rate cuts was lowered.
- UK large cap equities have remained flat over the month with banking stocks performing well recently. UK mid-cap equities have fallen and still looked under pressure from higher interest rates and increased minimum wage burdens.
- US high yield and corporate bond spreads have widened slightly but strong carry (coupon income) on the bonds has kept performance flat.
–
Asset Class Returns
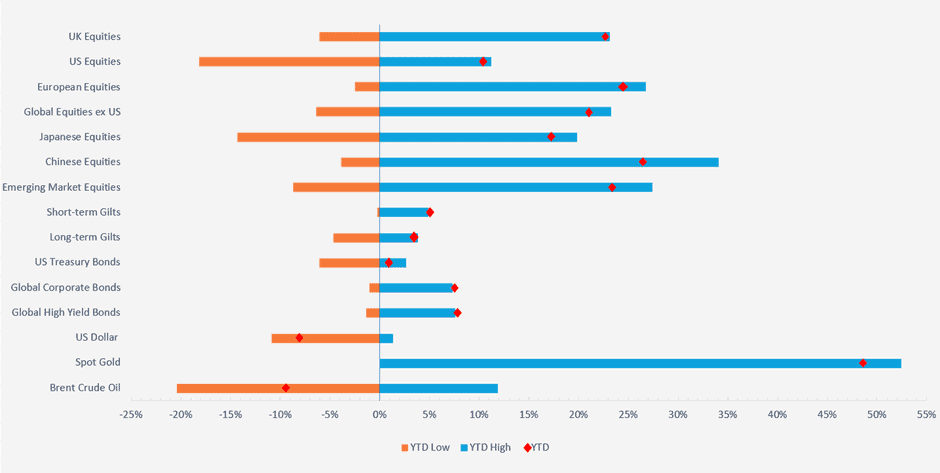
Selection of assets 2025 YTD returns and range of returns as at 27.11.2025 (the two ends of the bars represent the range of YTD returns and the red dots represent the current YTD return). Indexes used: FTSE All-Share, Russell 2000, STOXX Europe 600, MSCI World ex USA, MSCI Japan, MSCI China, MSCI Emerging Markets, FTSE UK Conventional Up To 5 Years, FTSE UK Conventional Over 15 Years, ICE BOFA US Treasury, ICE BOFA Global Corporate Hedged GBP, ICE BOFA Global High Yield Hedged GBP, US Dollar Index, S&P GSCI Gold Spot & S&P GSCI Brent Crude Spot. Returns hedged back to GBP with exception of US Dollar which is in US Dollar terms. Returns based on daily data. Source – Watson French with data from FE Analytics and MarketWatch. Data correct as at 27.11.2025.
–
US
Nvidia reported strong revenues in its recent earnings call and its market cap recently topped $5 trillion (nearly double the value of the FTSE 100). Since then performance has been negative, caused by the newest Gemini AI model released by Alphabet (Google). Performance of their model topped most benchmarks and it was built using Alphabet’s own AI chips, not Nvidia’s.
I think this is important to highlight and brings back to an old investing lesson – just because something is the biggest and best now doesn’t mean it always will be. Look at the GLP-1 weight loss drug for example; Novo Nordisk, the Danish Pharma company, had the first drug in the market and at one point its market cap was over $500 billion. It is now $165 billion while Eli Lilly, which came into the market just behind Novo, now has a market cap of over $1 trillion.
References and comparisons to the dot com bubble are widespread but it is becoming more prominent in managers’ minds – a recent Bank of America fund manager survey showed 45% of respondents view an AI bubble as the biggest tail risk. Market breadth is narrow and historically when markets have been this narrow the largest companies have underperformed markedly.
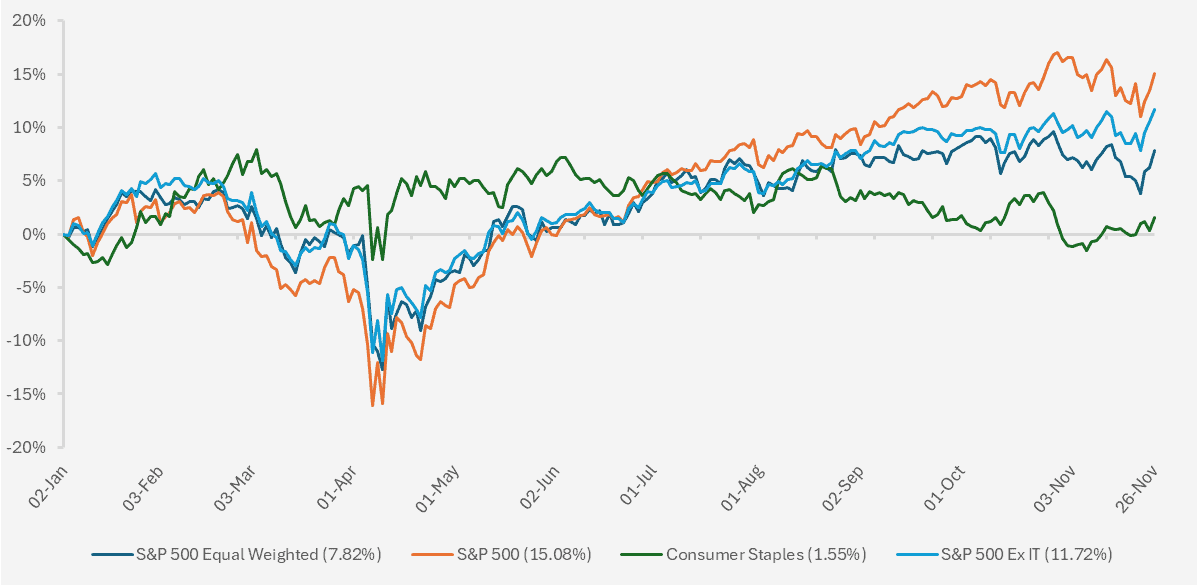
Chart showing YTD performance of various US equity indices and sub-indices (Source – Watson French with data from Financial Times/LSEG. Returns in USD. Data based on daily opening prices. Data correct as at 26.11.2025).
Uncertainty is picking up for a few reasons. The US government has finally reopened and we will start to get a steady flow of much-needed official economic data. Markets had not been getting data during the shutdown – if the data isn’t available there is not much they can do and markets carry on. Now the data will come through and markets are getting nervous.
Further to this, investors had forecast another interest rate cut when the Federal Reserve’s Open Market Committee (FOMC) meets again in December. Recent comments by Fed Chairman Jerome Powell and labour market data for September put this into doubt. On the other hand, other Federal Reserve FOMC voting members have indicated they will support a rate cut, creating a dynamic more similar to the Bank of England where dissent and non-consensus is higher.
Some estimates indicate the neutral real rate of interest (the rate at which growth is neither constrained nor stimulated) would be reached with one more 0.25% interest rate cut.
This is ideal if the labour market is under real strain as a neutral rate will help to further support the economy and under this economic strain we should see the rate of inflation fall as demand wanes.
However, if the labour market is stronger than expected in 2026 and inflation proves stickier then a mildly restrictive interest rate will be the better option. Making rates more supportive without inflation being under control is risky and could prompt later rate hikes.
We see markets not fully pricing in the probability of fewer interest rate cuts and this builds into the potential for a correction next year. We see a cautious Fed, led by Jerome Powell as we look to a change in leadership early next year.
Why do we see the possibility of inflation being stickier? For two reasons. First we still have not seen the full effect of tariffs on the US consumer. US investment banks are reporting that on their conversations with US companies they are telling them they have absorbed much of the tariff cost by way of lower margins. This feeds into the second point. At some point the margins need to reflect the share price of the companies, or we will see a fall in values or a pickup in margins (i.e. by raising costs for the consumer).
This could further lead to a stagflationary environment. Markets do not presently show this however, with various US financial condition indicators remaining strong.
The key question for inflation is where it is coming from. If it is demand-pull inflation, as the San Francisco Federal Reserve has shown, interest rates have to stay higher to bring this demand down.
However, we could see inflation settle and labour remain steady (a goldilocks scenario) and thus the Federal Reserve can pick up the pace of rate cuts. Markets are somewhat confused over labour market data and the “lost” data during the shutdown is not helping.
The delayed release for September showed unemployment picking up to 4.4% from the month before while the economy added 119,000 jobs. As we have seen in past months, there could be a revision downwards to this data on jobs added, but the two most recent points show a mixed view and a labour market in tension. Unemployment is still at a healthy level for the economy but a small deterioration in the jobs market can quickly push the unemployment rate up. This problem comes from the loss of foreign labour in the US economy and companies being in a “no hiring, no firing” state.
The second point for market pullbacks recently and increased volatility involves the developing financing needs of the big (and smaller) technology companies. There are various estimates as to what the investment in AI infrastructure will need to be, with common figures being $3 trillion. Half of this is expected to come from debt issuance, and we have seen this picking up.
Since September we have seen the biggest AI hyperscalers issue over $90 billion of corporate bonds. Other smaller AI related companies have also issued debt rated with a junk or high yield rating. With AI spending projected to be in the region of $1.5 trillion over the next few years we will only see more issuance. With global credit spreads tight due to low supply this could be good and release some of the pressure on the market. The costs of credit default swaps (insurance against a corporate bond defaulting) on AI related bonds has picked up recently as well, indicating more risk.
Until now AI investment by the big technology companies had been financed by their own cashflows. This meant that if the AI technology did not provide the revenue they needed or they were outcompeted, the risk was only on them and their shareholders. Now that they have started to issue debt, the risk becomes more systematic.
Meta has issued a standard corporate bond and an off-balance sheet financing structure. This complexity begs the question as to why it is necessary. Meta does not want this on their balance sheet, as it wouldn’t look as financially strong and because the depreciation of assets would impact its earnings per share. There is also some creative accounting going on under the surface.
Most of the datacentres under construction use Nvidia or AMD (Advanced Micro Devices) GPUs which only have a limited life span. Estimates put 60% of the cost of a data centre down to Nvidia’s products and so when they need to be replaced, this becomes costly.
This type of off-balance sheet financing hides risks in the system and is more commonly seen near the top of markets. The big technology companies have performed so well in recent years because they are asset-light businesses. This need for data centres and physical assets changes their business model and they may not continue to get the beneficial treatment from investors that they are used to.
So far the corporate bond issuance has been absorbed into the market. With corporate bond spreads tight because there is not enough supply this should help to ease some pressure on spreads.
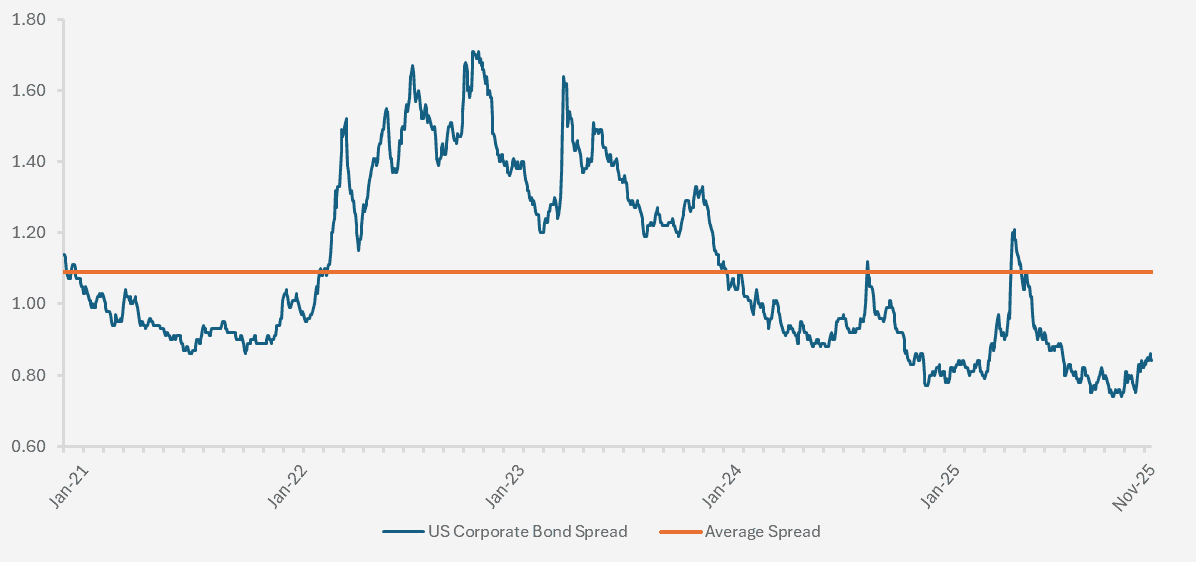
Chart showing ICE BofA US Corporate Index Option-Adjusted Spread over a five year period from 26/11/2020 – 25/11/2025. (Source – Watson French with data from St Louis Fred & ICE BOFA Indices. Data based on daily data points. Data correct as at 26.11.2025. The blue line shows the difference between the yield on US investment grade corporate bonds and a spot treasury curve. The orange line shows the historical average over the five year period. The lower the line the tighter the spread the less compensation a bond hold receives for the credit risk involved in investing in corporate bonds. Put another way the lower the line the more expensive corporate bonds are).
That being said, spreads remain tight and risks are skewed to spread widening.
Going forward we remain keenly focused on how AI spending evolves and which companies can monetise their offering effectively, along with what the upcoming economic data releases say about the state of the US economy.
–
UK
The Bank of England met earlier this month to vote and opted to hold interest rates at 4%, citing upside risks to inflation still being present. It was a close vote with five members voting for a hold and four for a cut. Andrew Bailey, the Bank’s Governor, broke the deadlock with a vote to hold rates where they are, saying that he would “prefer to wait and see” if prices were to continue moving upwards.
The latest inflation data showed CPI falling to 3.6% in October, down from 3.8% the previous month. Services inflation also tracked down to 4.5% from 4.7% in the previous month.
There continues to be a debate as to whether inflation is sticking higher or we are continuing to see one-off effects from the previous employer National Insurance increase and minimum wage increase in April. This will be exacerbated in April 2026 by the further minimum wage increases.
If these higher employer costs are one-off impacts, higher interest rates will continue to drag down economic growth unnecessarily.
GDP growth for the third quarter was just 0.1%, losing steam from the 0.3% increase in the second quarter as September growth shrunk by 0.1%. Markets had expected growth to correct somewhat after the April tariff mania. Unemployment also rose to 5.0% in September from 4.8% the previous month.
We see major issues with the youth unemployment rate and the additional increases to minimum wage. For workers aged 18 to 20 the increase is 8.5% and for everyone else the increase is 4.1%. Unemployment for people aged 16 to 24 for Q3 2025 was 15.3%, much higher than the top line 5.0% rate. With higher increases in costs for younger workers and more companies looking to replace workers with AI and technology, we see this as a long term structural issue. Combined with an ageing population, we will see strain on the amount of tax revenues the government can collect and how much of this needs to be spent on the welfare system.
In terms of investments we see several implications from this over the long term. The first is that if youth unemployment keeps picking up, growth will remain sluggish and government tax receipts will remain lower than otherwise. This means the government will need to increase tax on working people, which further lowers growth unless the government borrows more. We see a combination of both borrowing and increased taxation over the long term as likely and this will keep bond yields high. For this reason we like the attractiveness of UK debt in its ability to produce positive real returns with strong carry, but remain wary of fiscal dominance.
We also see the potential for a favourable environment for longer term gilts. Long term gilts tend to do well in times of slow or falling economic growth when interest rate cuts look more likely. Long dated bonds have a higher duration – that is, a higher sensitivity to changes in interest rates. Coupled with the Debt Management Office’s indication that they will issue less long term debt, and the Bank of England reducing quantitative tightening at the long end of the yield curve, this creates a demand/supply imbalance. In the low growth environment demand for long term gilts could pick up and with a lower supply this will push prices up. On the other hand, if inflation starts to rise the real value of long term bonds will be eroded, pulling prices down and yields up.
Gilt holders are being paid a positive real return to wait while the Bank of England decides on interest rate moves. We see the downside as more limited and the upside as greater and so a favourable asymmetric return profile (opposite to what we see for equities and corporate bonds). If we do see a drawdown in the economy the government really only has the monetary policy lever to support the economy and not the fiscal lever, as the government runs a budget deficit already.
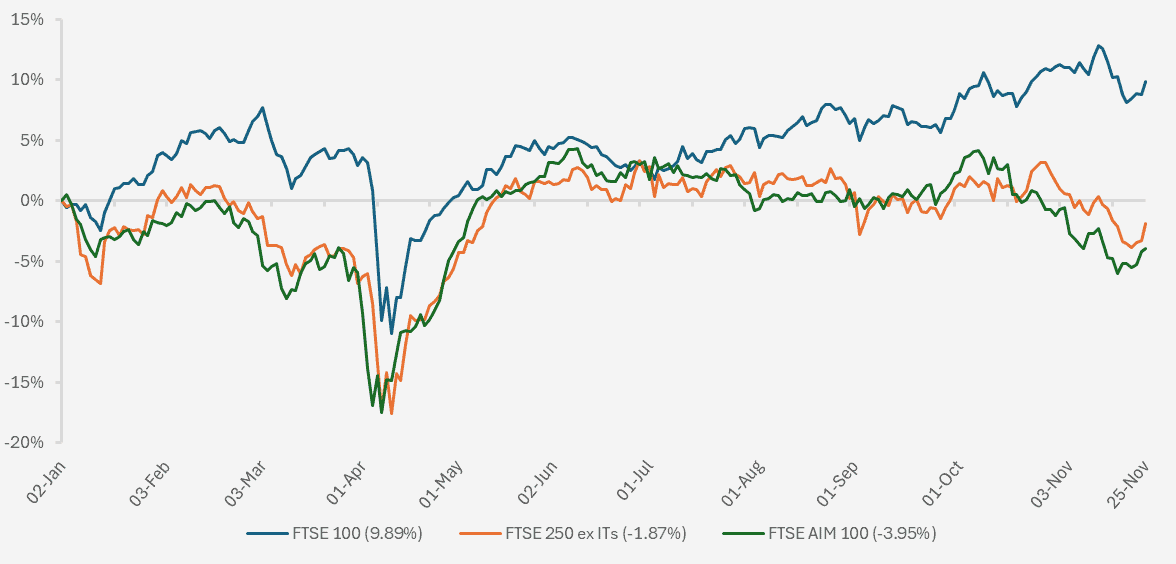
Chart showing YTD performance of various UK equity indices (Source – Watson French with data from Financial Times/LSEG. Returns in GBP. Data based on daily opening prices. Data correct as at 26.11.2025).
Domestic and small cap equities look likely to continue to struggle in the short term but also over the long term due to the issues discussed above. The solution is increased investment in technology and other productivity enhancing measures – something which was missing from the Budget yet again.
We continue to view UK banking stocks positively. Interest rates remain high and their net interest margins are strong. Defaults on loans and borrowing are low and they were able to avoid tax increases in the Budget.
The FTSE 250 index is more representative of the domestic UK economy in some ways, but as we spoke about before it is heavily represented by investment trusts, which have no bearing on the UK economy. With investment trusts included in the index the year-to-date return is a strong 9.72%. As we can see in the chart above, when we take these out the index isn’t doing so well.
–
Europe
It doesn’t happen often but throughout 2025 most major European stock markets have outperformed their US counterpart, the stalwart S&P 500. Recently however we have seen a change in fortunes as over the past three months, European markets have begun to lag and in local currency terms the US has caught up. The European economy looks sluggish in some places but this year the equities have done well and for a while attracted the outflows from US equities.
The chart below shows that over the past twenty years European equities as a group have only beaten the S&P 500 in six of the calendar years. YTD the performance is now neck and neck. What this shows us it that while the April Liberation Day tariffs were very damaging in the short term, over the longer term more structural developments and company earnings drive markets.
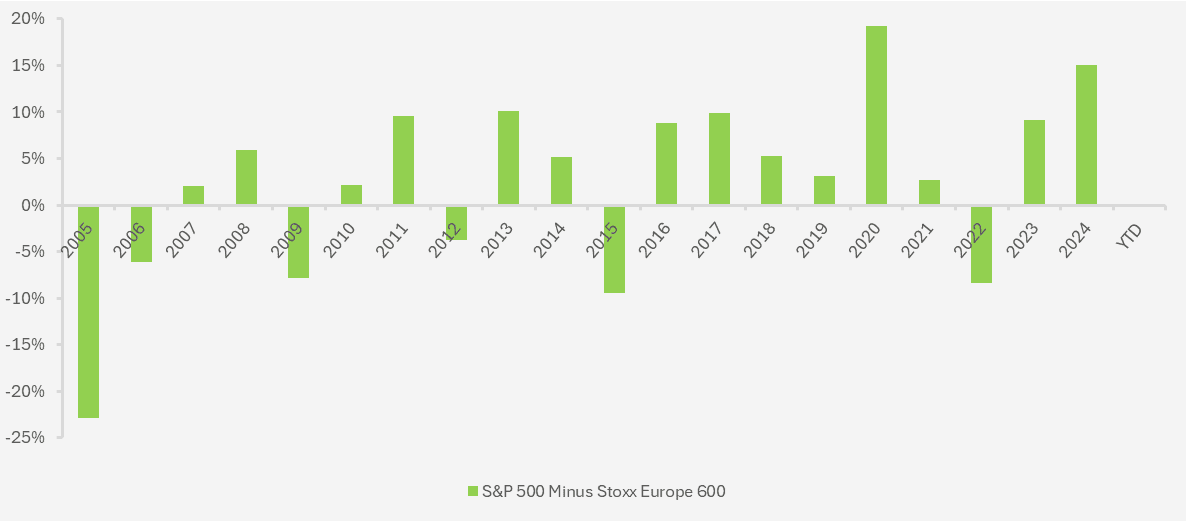
Chart showing the difference in annual calendar year performance between the S&P 500 and the Stoxx Europe 600 Index. (Source – Watson French with data from FE Analytics. Data based on local currency returns of indices. Data correct as of 27.11.2025).
Germany remains under pressure as its manufacturing sector struggles. Data showed that for the first time Germany imported more from China than it exported to them. Adding to this frustration is the recent reporting that suggests the huge German spending package may not be as good as it seems. Some of this spending may be taking account of spending that has already happened.
Defence spending is useful in some ways – manufacturing is increased, employment in defence companies may pick up leading to more spending by consumers. But when we look at what is actually being produced (bombs, warships etc.) we do not see as much benefit as spending in other areas may produce. After all, once a defence product has been manufactured it either sits there waiting to be used (no effect on growth) or is used and is negative to growth.
Germany is an industrial and manufacturing-heavy economy and with advances in technology and competition from China we see real long term pressure on growth.
Markets’ optimism may therefore be misplaced in the long term. The former Italian Premier Mario Draghi published a report in September 2024, setting out 383 recommendations to make the EU more competitive and productive. Over a year has passed and just over 11% of these points have been implemented. The stock market and economy do not go hand in hand, but it does have an effect on certain stocks in different sectors and overall business and consumer sentiment. Therefore managers remain selective in European sectors and countries.
Like the UK we see value in European banks with loan growth potentially picking up. To be competitive with US banks Europe needs consolidation, which looks unlikely. Take Italy for example, which has recently blocked the merger of two European banks which the EU is now confronting. Europe loves regulation but it is making itself less competitive relative to the US and China.
–
Japan
Japan’s economic picture looks messy. Tariffs from Trump are affecting exporters and to combat this to some extent, the new Prime Minister unveiled a new stimulus package which we spoke about in our introduction.
Japan also recently angered Beijing by talking about Taiwan and war. This was promptly followed up by a rare call between President Trump and President Xi Jinping, ending with a phone call from Trump to Takaichi urging her not to aggravate China.
Other than the fact that Trump likes a phone call, we look to Taiwan’s importance for the US semiconductor supply chain as to why Trump is trying to appease Jinping.
For years daring investors in Japanese bonds engaged in a trade which bore the name ‘the widow maker’. The premise is simple – borrow money cheaply in Japanese currency (as interest rates were negative) and short (borrow an asset and then sell it, hoping prices will fall and you can buy the asset back at a better price and profit from the difference) Japanese government bonds in the expectations that their yields would rise and prices fall as debt-to-GDP climbed higher.
The problem is that yields did not rise and so the trade lost a lot of money, and many traders their jobs, hence the name. As we pointed out in a previous commentary, a high percentage of Japanese government bonds are held by the Bank of Japan and the ability for bond vigilantes to move prices is more limited. Also, Japan’s assets were growing at a faster rate than its liabilities and so the net debt position was not as bad as it seemed.
Finally though this trade may be reaping profits. For the past three years we have seen a sustained rise in Japanese government bond yields.
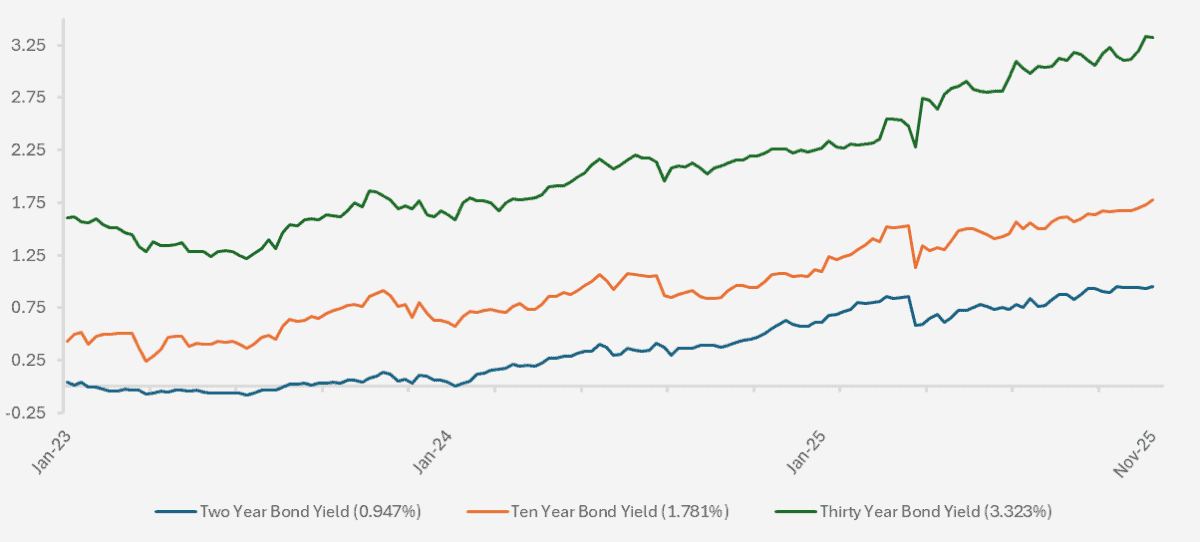
Chart showing the Japanese government bond yields over a period from 01.01.2023 to 25.11.2025 (Source Watson French with data from Investing.com. Yields based on weekly opening yields. Data correct as of 27.11.2025).
Not only have we seen yields rise but we are also seeing a steepening in the yield curve (see chart below).
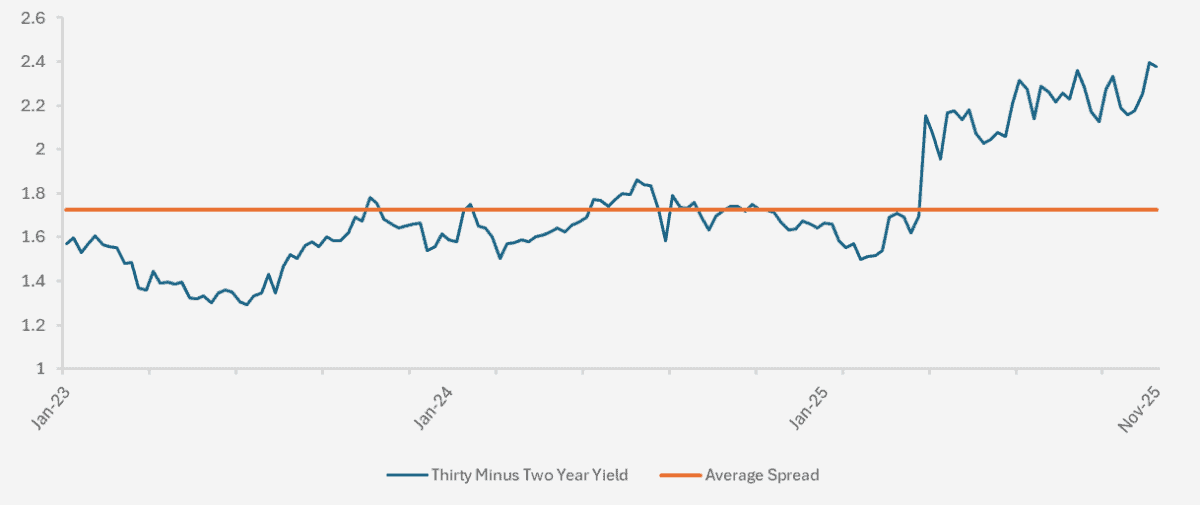
Chart showing the yield spread between the thirty year and two year Japanese government bond yields from 01.01.2023 to 25.11.2025. (Source Watson French with data from Investing.com. Yields based on weekly opening yields. The blue line shows the difference in yield between the two maturities. As the line rises the spread is greater i.e. the thirty year bond yield is rising at a faster pace than the two year bond yield. Orange line shows the historical average spread over the period. Data correct as of 27.11.2025).
Yields are rising because of the stimulus package announced recently by the Prime Minister. First of all, part of this is unfunded and will need to be funded by debt. We will therefore see a greater supply of Japanese government bonds in the market which will push yields up. Secondly, this stimulus is likely to be inflationary and may push up inflation from its current 3.0% level. This, combined with pressure on the Bank of Japan to keep rates lower and a weaker Yen (pushing up the cost of imports), could result in higher inflation down the line and to combat this, higher interest rates. We speak about this a lot in the commentaries because it is a very important point.
Bonds are already reflecting markets expectations for this, and we can only wait and see how the situation unfolds.
A consequence of rising Japanese bond yields is that it may attract capital away from the US treasury market. As the US runs a budget deficit it relies on foreign investors buying US debt to balance the books. As a global powerhouse, Japanese government bonds may be an attractive alternative and this could result in higher US yields.
–
Robert Dougherty, Investment Director
December 2025
This article is not a recommendation to invest and should not be construed as advice. The value of an investment can go down as well as up, and you may get less back than you invested. Data is correct at time of writing and cannot be guaranteed.