1st November 2026
France in particular has been hit hard as protestors took to the streets to show their frustrations. Certain French government bonds now yield the same as some French corporate bonds, showing investors’ concerns around France’s fiscal and debt sustainability. Corporate bonds usually yield more than government bonds as they contain a premium for credit risk (i.e. a business cannot print money to meet repayments if it runs into financial difficulty). The spread of French bond yields over German bond yields widened as well and the risk here is whether this becomes contagious and spreads to other yields in Europe.
Investors have been putting out their theories on why global government bond yields have been rising. A common explanation has been that the rise in bond yields isn’t because of inflation but rather because of rising real yields, as inflation expectations for the next ten years are fairly well anchored. This means they think good economic growth is driving yields higher.
Near the end of the month, following a daily fall in markets which was blamed on Meta and Mark Zuckerberg, real yields suddenly fell and investors questioned whether growth was the right explanation. As we have said before, the rise in bond yields has been a normalisation or a reset. We think there are various reasons why bond yields are higher and so don’t pay too much attention to calls over falling or rising real yields. This short term price action is heavily driven by highly leveraged hedge funds and we look further into the future when assessing trends. In the US, real yields could well be the reason for increasing bond yields but in the UK and Europe with growth sluggish, we don’t think this is accurate.
Inflation has been moving in the wrong direction lately but breakeven inflation rates point to stable inflation over the longer term. This says that markets think inflation to be either transitory, whether this be through the war in Iran or that AI will be extremely deflationary, or they think central banks will increase interest rates high enough to crush inflation. If the latter was the case we would see real yields lower as higher rates will damage growth. After 2022, we think it is dangerous to look at inflation as transitory.
We note that oil prices remain high but according to some data, there is actually more oil coming out of the Strait of Hormuz than there was before the war started. Recent weather and public service announcements will also add pressure on inflation but also damage growth.
The focus in the US is on the mid term elections. For markets we expect there may be some short term volatility as there always is during periods of uncertainty or change, but ultimately other factors are driving markets and so we don’t expect too much in the way of movement over the medium term. For example, the war in Iran is a presidential decision and so even if the Democrats gain more power, they couldn’t necessarily stop it.
Emerging markets saw a bumpy month driven by three stocks which make up nearly 30% of the index – TSMC, Samsung and SK Hynix. These are all stocks which have performed well because of AI spending. Investing in the broad index doesn’t give you the diversification you may think because of these three stocks. It isn’t just concentration in the US investors need to be careful of.
Investment grade corporate bond spreads have widened over the past month, likely driven higher by technology companies which are making up an increasing share of the index. They still remain well below their three-year high however. Investors have recently compared holding tech-related investment grade corporate bonds to government bonds but we think this is foolish and forgets the credit risk inherent in corporate bonds.
–
Areas of focus
- Technology stocks have wobbled with concerns over how much is being spent and how much growth this will actually deliver.
- Suppliers to the AI infrastructure buildout have been impacted particularly hard, with memory companies falling and giving up much of their gains for the year.
- On the face of it emerging markets have had a hard time, but the concentration in three technology companies is driving this and the regional picture is somewhat different.
- Global bond yields continued to rise with France feeling the heat in particular. Despite rising yields, good income from bonds will offset this to some extent.
- Short dated bonds have seen bigger yield increases relative to longer dated bonds, but because they have a lower duration (sensitivity to changes in yields) they have had smaller capital losses.
- High yield bond yields and spreads continue to widen with the lowest rated US companies having yields at over 18%. As they tend to be short dated this will increase the pressure on their finances.
- Despite a short term rally the value of gold fell as increasing real yields weigh on its value.
–
Asset Class Returns
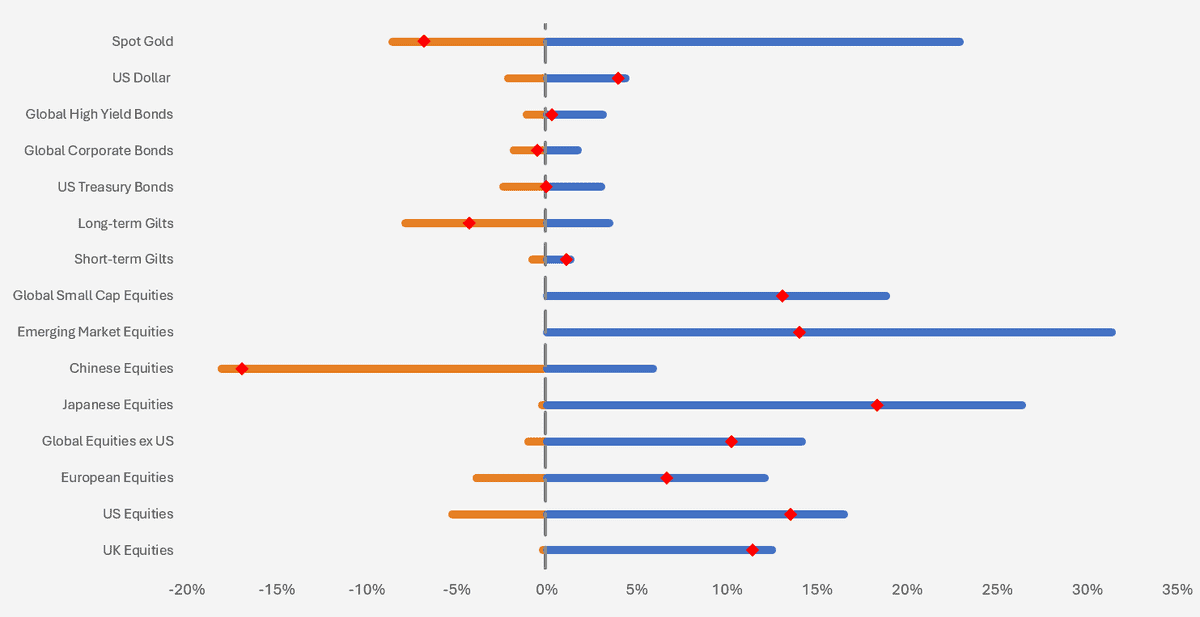
Selection of assets 2026 YTD returns and range of returns as at 26.10.2026 (the two ends of the bars represent the range of YTD returns and the red dots represent the current YTD return). Indexes used: FTSE All-Share, Russell 3000, STOXX Europe 600, MSCI World ex USA, MSCI Japan, MSCI China, MSCI Emerging Markets, MSCI World Small Cap, FTSE UK Conventional Up To 5 Years, FTSE UK Conventional Over 15 Years, ICE BOFA US Treasury, ICE BOFA Global Corporate Hedged GBP, ICE BOFA Global High Yield Hedged GBP, US Dollar Index & S&P GSCI Gold Spot. Returns hedged back to GBP with exception of US Dollar which is in US Dollar terms. Returns based on daily data. (Source – Watson French with data from FE Analytics and MarketWatch. Data correct as at 27.10.2026).
–
US
Real GDP growth for the second quarter was revised upwards from 1.5% to 2.5% with consumer spending and investment stronger than previously thought. The investment growth is driven by construction of AI infrastructure and the consumer spending shows that on the face of it, broadly consumer finances are still stable. We think this is misleading, with lower income consumers who use more short term debt coming under increasing pressure from higher fuel prices and higher interest rates.
We comment on two inflation measures, CPI which is more widely known and the Personal Consumption Expenditures (PCE) index which is preferred by the Fed. Each measure differs in what it includes and its methodology. PCE rose by 3.4% year-on-year in August, in line with the previous month. On a monthly basis PCE rose by 0.3%. Core PCE (excludes energy and food prices) was 3.0%, rising by 0.2% on a monthly basis.
US CPI in September rose from 3.4% in August to 3.7%, with core inflation also rising from 2.4% to 2.6%. Real wage growth slowed as pressures on households build. It was only recently that Federal Reserve Governor Christopher Waller said the Fed has some flexibility on rate hike timing which eased some market anxiety, but with this inflation data markets expect more rate hikes again. While one piece of inflation data isn’t definitive, it isn’t moving in the right direction and if the direction of travel continues upwards we will certainly see more rate hikes.
There were some concerns over the recent labour market data, which showed that 29,000 jobs were added in September, down from the 133,000 revised jobs added in August. Unemployment ticked up from 4.1% to 4.2%. While the data doesn’t show a sharp weakening, neither does it show a strengthening market.
Declining immigration and the increasing number of baby boomers retiring means that the breakeven job growth is not as high as it has been in the past, and while some investors believe the Fed should stop hiking rates because of the lower than expected growth, taking a high level view shows growth is actually looking fine. With real GDP growth still strong we expect the Fed to stay the course as inflation looks sticky.
There are many potential reasons as to why bond yields are moving higher and we have spoken a lot about this lately. A model developed by several Federal Reserve economists attempts to break down treasury yields to look at what is driving them. They found that the expected path of real short term rates has moved higher over the next ten years i.e. markets expect interest rates to stay higher. They also found that the term premium has risen, which is the additional yield investors demand to hold a longer term bond. This points to longer term risks rising, such as fiscal sustainability.
Rather than any one point we think it is a combination of these points and more. The simplest explanation is often the right one and to us, we think it is simple supply and demand dynamics. As supply increases (increasing government debt) and demand wanes (increased corporate issuance from the AI buildout and quantitative tightening redirect capital), the return investors demand goes up. Unless the supply or demand part of the equation changes yields will go up and higher inflation among other factors will only put upwards pressure on yields. The normalisation of the Japanese economy is also a big weight on the demand for global bonds at a time when supply is increasing. How do we see demand increase? In a market drawdown, when investors are looking for safety.
The chart below shows the two year US treasury yield has risen a lot more than the ten and thirty year yields. Some of this is because the US Treasury has shifted to issuing more shorter term debt and less longer term debt, but it points to markets expecting short term rates to be higher.
Despite rising government bond yields, it looks more attractive than ever to invest in government bonds. This is because the most important aspect of a bond’s return is what its starting yield is.
Analysis from M&G looked at the starting yield of the 10-year US treasury in 2022 which was 1.51%. Holding this until the bond matures would have given you a return of around 1.51% pa.
On 30th September 2026 the yield of the bond was 5.29%. The change in the yield over this period was 3.78% and holding the ten year US treasury bond would have returned you -13%, or -2.9% pa. This is because of how bond yields respond to changes in interest rates and the convexity of yield curves.
But if you held that 5.29% yielding bond now, over the same time frame if yields rose by the same 3.78% your return would be 9.3%, or 1.9% pa. To note, if yields rose to 9.06% it would be a nightmare scenario and the probability attached to this is extremely low. The same change had a much smaller impact for two reasons.
The first is that your starting yield is much higher and the income you receive is much more attractive, so this cushions a lot of the capital losses you would receive from an increase in yields. The second is that bond yields are convex. Starting from a small yield, even a modest increase has a big impact. But as the yield is higher, the same changes have much smaller impacts. So all of this is to say despite yields moving up, headlines pointing to doom and gloom and many global investors having stated over the past two years that the use of government bonds in portfolios is pointless, we strongly disagree and see great potential in them.
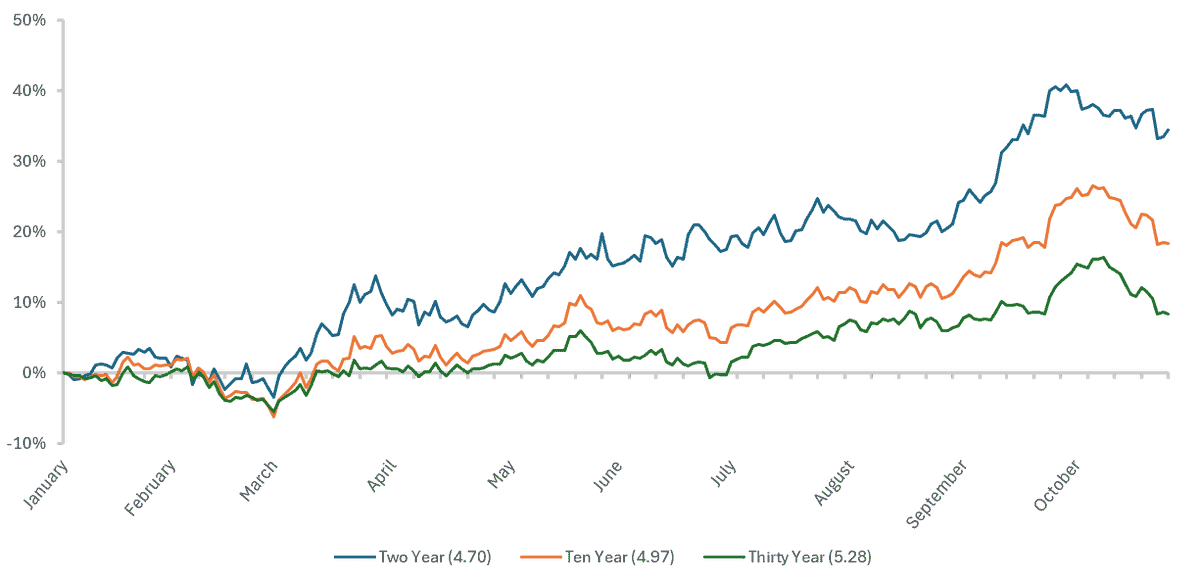
Chart showing the cumulative change in US treasury bond yields this year. In brackets is the current yield of each maturity. (Source – Watson French with data from Investing.com. Data period runs from 02.01.2026 to 26.10.2026. Data correct as of 27.10.2026 and is based on daily opening yields). The greater rise in the two year yield relative to the higher maturity bonds shows a flattening yield curve. This is an expectation for higher interest rates over the short term.
At the time of writing the yield on the ten year US treasury is 4.97%. This is attractive in nominal terms and after adjusting for inflation. Adjusting for the ten year US breakeven inflation rate of 2.34% (this is what markets expect inflation to average in the next ten years) gives us a real yield of 2.58% pa.
If markets take a nose dive and economic growth turns negative, yields should fall and you will benefit from the income and the capital gain from a falling yield. So we see government bonds as offering good protection from an economic slowdown and a very attractive income. The test is getting the duration right to maximise returns. The risk for government bonds is an inflation shock, but as we showed with strong starting yields the risk isn’t as high as it was in 2022.
Technology stocks have had a wobbly month, with some companies experiencing large drops as investors now question the economics behind their AI spending and business strategies (this has been apparent before but momentum and the fear of missing out can make investors ignore these things). Basic financial principles say that the cost of financing an investment must be made up by cashflows generated on that investment and an excess return to compensate for the risk of the investment. Higher financing costs means the return needed must be higher, so we are not surprised by a fall in technology company values. We also think investors are attributing a low risk to these investments, keeping stock prices high.
A paper by the Brookings Institution forecasts the investment needed in data centres, power and network infrastructure and specialised chips and other equipment will total $10.3 trillion between 2025 and 2032, equating to 3.63% of US GDP each year. Between 1870 and 1890 the buildout of the railway system cost an average of 2.2% of GDP a year, which is the largest investment in US history. This investment has to generate enough revenues to make it worthwhile. If it doesn’t, share prices will fall to reflect this.
Bonds issued by technology companies have come under pressure with yields rising and the premiums on credit default swaps (CDS) rising (CDS are a form of insurance against defaults).
Competition is increasing in the AI space and interest rates are higher, and not everyone can be a winner. As we mentioned before, it will likely not be companies like Microsoft and SpaceX which see the biggest falls in values should we see a correction. It is the companies which are entirely or mostly reliant on AI spending which will see the biggest falls. Think energy companies, industrials providing parts for data centres, and perhaps companies like Nvidia, where estimates put 91% of their revenue being linked to AI infrastructure.
–
UK
We strive to include factual and accurate information in this commentary but when we saw the IMF upgrading the UK’s economic growth outlook to be one of the fastest growing economies in the G7, while also stating it will emerge as a winner of the AI tech boom, we couldn’t help but conclude this to be a wild fantasy and therefore mention this piece of fiction in the commentary (as you can see, we have strong feelings about this). While it may prove to be true, from our observations IMF forecasts (and that of any financial institution) tend to be wrong and we never see them comment on how accurate their old forecasts were.
The IMF forecasts UK GDP growth to be 1.3% in 2026. They then forecast growth of 1.2% in 2027. In a hot market with above target inflation this sort of growth isn’t strong. We never pay much attention to global financial bodies’ economic forecasts because they are often wide of the mark and are not informative.
The latest data showed the UK economy growing by 0.1% in August, which the FT described as ‘defying expectations of a contraction!’. The latest quarterly growth was 0.7%. While the case for rising bond yields may be attributed to rising real yields (i.e. strong economic growth) in the US, we don’t see this as the case here and believe inflation and fiscal concerns are pushing the yields higher. UK CPI was reported at 3.5% in September, increasing from 3.1% the previous month. Government borrowing was also £1.9 billion above the OBR’s guess. The Bank of England may well raise interest rates because of this data but with borrowing already stretching the government’s fiscal headroom, any more rate increases will further strain this and damage growth.
Europe and the UK are helping to finance the AI infrastructure buildout without owning any of the infrastructure or technology, and in return they will be customers of the technology companies in using AI. We can see how it may translate to growth over the longer term but it puts the UK at a huge risk if the US decided to halt access to the technology. We have seen this again recently, with Ukraine struggling to access SpaceX’s Starlink satellite network over political issues.
We believe income is a very important component of a stock’s overall return. It can be reinvested and compounded over time and historically it has been the biggest factor of a stock’s return. The volatility in income tends to be less than that of share prices and it gives a good indication of a company’s value and the stage it is at in its industry lifecycle. It currently provides some diversification away from technology and growth companies, which have dominated the last decade and when markets fall it provides some form of protection from the downturn. This is both in terms of the income offsetting some of the share price decline, and dividend paying companies tending to be more mature and have lower P/E ratios.
This is a big reason why the UK market is attractive and despite lower growth prospects and less tech exposure, it still provides a valuable place for capital. We can see in the table below that there are just two other markets which have higher dividend yields – France, and frontier markets (which are inherently a higher risk). Over the past twenty years around 70% of the UK market’s return has come from dividends (see chart below). The UK also looks fairly cheap relative to other equity markets, even though it has seen strong returns over the past few years.
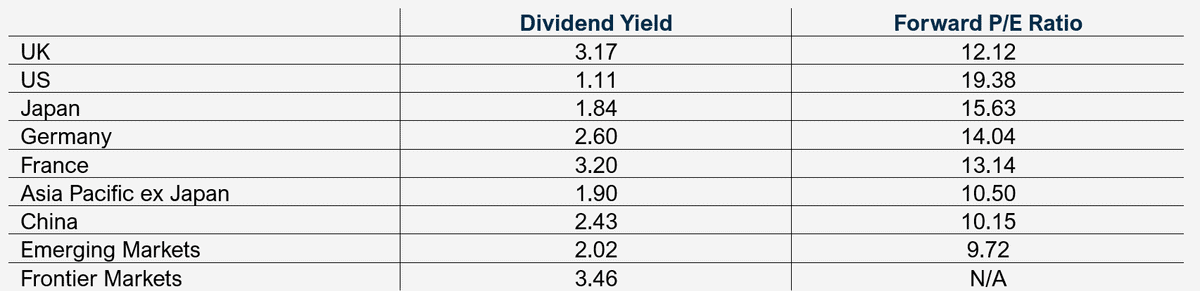
Table showing the dividend yields and forward P/E ratios of regional equity markets as represented by MSCI indices. Data from MSCI and is correct as of 30.09.2026.
Recent large dividends from banks and mining companies have pushed the third quarter dividends in the UK to their highest level in seven years, growing by 14.1% overall. Share prices have risen lately which has pushed the yield down, but they are still very attractive. Banks’ dividends rose by 24.5% on a yearly basis and mining companies by 89.6%.
There are risks in the UK market though. Mining companies benefit from rising commodity prices and so in an economic slowdown their profits and dividends will decrease. In the inflationary environment with growth still positive and the demand for commodities high, profits should keep pushing higher. AI infrastructure is a big source of demand for natural resources as well.
Banks benefit from rising interest rates as their net interest margin is higher. All else being equal, in a higher rate environment banks do well. They are also benefitting from the AI financing needs as they advise and place debt into the markets. So if AI spending does slow down, some parts of the UK market will be impacted, though likely by a lower extent than the AI companies themselves.
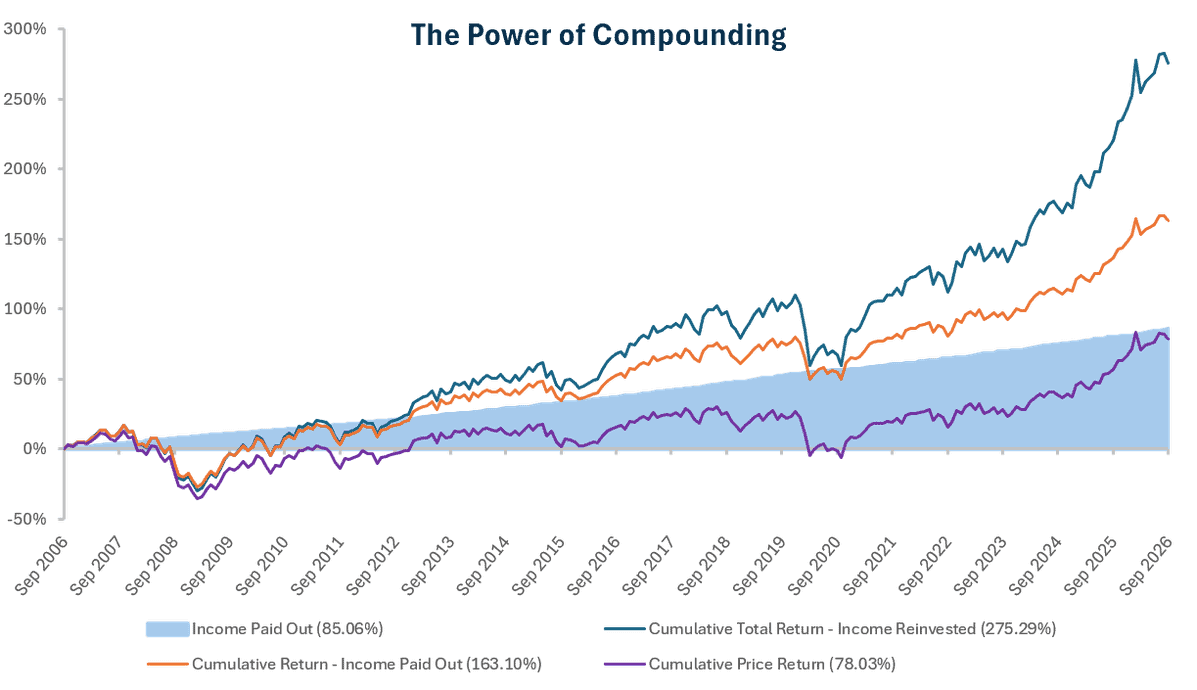
Chart showing the cumulative return breakdown of the FTSE 100 over a twenty year period. (Source – Watson French with data from FE Analytics. Returns based on monthly returns. Return period runs from 30.09.2006 – 30.09.2026. Data correct as at 27.10.2026). Total return = price growth plus income.
It is easier to see on a chart why we like income. The above chart shows the returns of the FTSE 100 over a twenty year period. There is a lot going on but we will break it down.
The light blue shaded area shows the income paid out from your investment over time. As we can see, between 2006 and 2012 this made up a significant portion of the return because the price growth in the FTSE 100 was negative/very weak. The purple line shows the return based on the capital alone with no income taken or reinvested. The orange line shows the cumulative return over time if you receive your dividends and rather than reinvest them, i.e. you take them as cash. The blue line shows the effect if you reinvest these dividend payments into the index. As we can see, the difference in your overall return if you withdrew the dividends rather than reinvesting them is huge – 112.19% over twenty years, which is 3.83% pa. This is particularly pronounced from 2021 onwards, especially so from 2025 when share price growth jumped.
Price growth over this period was 78.03%, so it is really the income and reinvestment of the income over time which drives the return. Income has two purposes here. It provides a return even when price growth is negative and so helps to cushion your return in negative markets. Its other purpose is to buy shares in the index, and so when the share price is positive you have the growth in your original investment and in the shares purchased by your reinvested dividends. In order to do this you need companies which pay dividends, which as we saw, the UK market is full of. You also can only benefit from dividends and compounding by staying invested, which is key. We can see from 2021 onwards the performance of the blue and orange lines really diverges. This is because the share price performance improves and all of the dividends that were reinvested into the index since 2006 are now experiencing that share price growth, rather than just your original invested capital.
–
Europe
France’s bond yields have been hit particularly hard lately and some are even worried about a full blown debt crisis in the country. While this is damaging for France, it would also have wider implications for other European countries. We are not yet at that stage, but pressure is building.
The governor of the Bank of France has said that interest rates are high, the cost of servicing debt is high and the deficit has to be brought back below 3%, and the debt has to be cut.
Rising interest rates will put more pressure on the country and although this is evident in bond markets, tensions with the French populace are rising with protests increasing as people are not happy with the country’s public finances. People want more money to be spent on infrastructure and public spending, but investors are selling the debt and driving up the cost as they perceive France to be fiscally irresponsible. France borrows more than Italy, which was previously the country with the biggest debt problems in Europe. Some French corporates now borrow at rates lower than the government. French debt is 120% of GDP and interest costs on this debt account for more than education or defence spending.
This isn’t something that has happened overnight, but France has been on this track for a long time. Adding higher interest costs into an essentially frozen political system where they cannot cut spending or reduce the debt burden will cause problems, and at some point possibly a meltdown. The key will be whether they can pass a budget to achieve these goals and so much focus is on the election next year. There is hope for investors, evidenced by Italy improving its fiscal position since Prime Minister Giorgia Meloni took office in 2022.
While France is in the spotlight, this is something all economies are either needing to face or they will be soon enough.
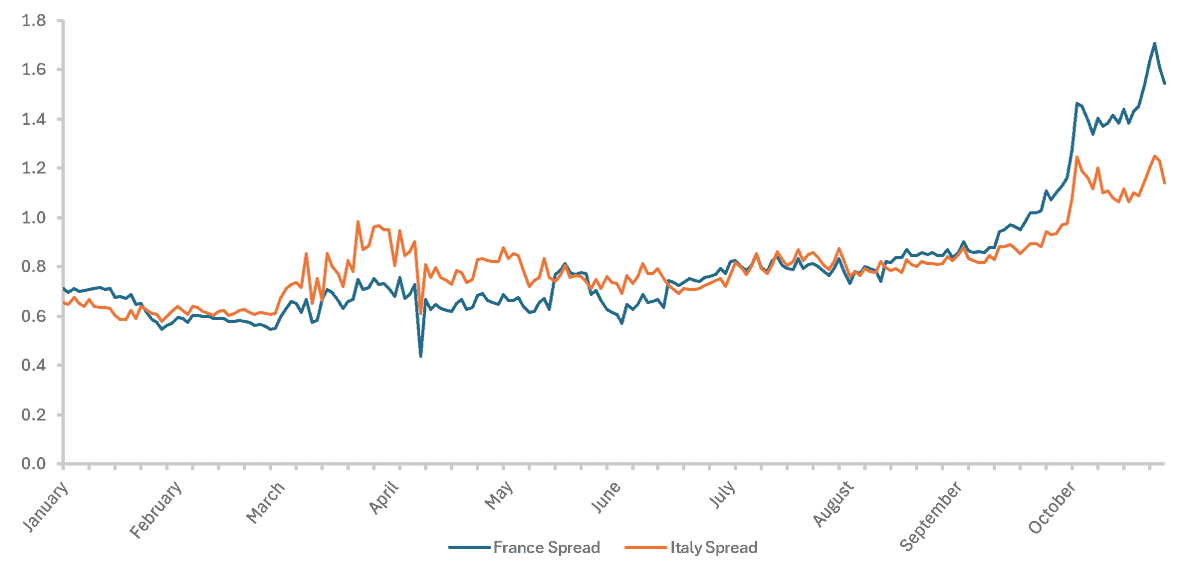
Chart showing the yield spread of French and Italian government bonds over German bonds. (Source – Watson French with data from Investing.com. Data period runs from 01.01.2026 – 27.10.2026. Data correct as of 27.10.2026 and data is based on daily opening yields). When the line moves upwards the difference in yield between the French and Italian debt relative to German debt increases.
–
Japan
One of the major driving forces behind equity performance in Japan has been the improved shareholder reforms that the Tokyo stock exchange forced upon companies, pushing them to sell off unrelated periphery businesses, stop hoarding cash on their balance sheets, to pay dividends and ultimately improve the return on equity for shareholders.
The reforms are continuing with the Topix equity index introducing rules which would remove the bottom performing stocks with lower free-float market capitalisations from the index.
The effects of this will be two-fold. First, it should push companies to improve their performance in order to stay in the index, otherwise they face ejection. There are around 1,700 stocks in the index, down from 2,200 last year when stocks were removed in line with previous reforms. Currently 683 stocks are at risk of removal. If competition and fundamentals improve this should drive returns over the longer term.
The second effect will be to improve the potential liquidity and attractiveness of the index. Unlike the Nikkei 225 index, which is a crude price weighted index, the Topix index is market cap weighted and a broader representation of corporate Japan. But this also makes it harder to track for index funds as there are many more stocks to purchase with lower liquidity levels, which makes it expensive. Removing these stocks with lower liquidity levels and those which do not perform as well could make it an easier index to track, which increases inflows. This would benefit stocks in Japan by increasing demand.
We spoke previously about the mechanical flows of pension funds and insurance companies going into index trackers each year. With the S&P 500 becoming more concentrated and the breadth of performance narrowing, improvements in Japan could see money flow here. At the end of the reforms there should be at least 986 stocks, according to JPX Market Innovation & Research who are overseeing the reforms. This sounds like a lot of companies being removed, but in market cap terms it represents less than 3% of the current index.
The downside would be for investment funds investing in smaller Japanese companies, where the liquidity and cost of buying some of these companies would be more expensive. It could also increase the concentration of the index in certain areas, especially if these are AI-related, which would push up the correlation with the US markets.
In another sign of improving confidence in both the Japanese stock market and the Japanese economy, the Bank of Japan’s quarterly data of Japanese household assets shows that the value of equities and investment trusts held by households rose by 44% compared to a year ago. Cash has fallen to 45% of household total assets and while this is still high, it is the lowest level in decades. Cash has also been invested into Japanese government bonds by households and there is still a lot of runway for a lower cash balance. These point to more signs of optimism with the consumer and hopefully this trend can continue.
–
Emerging Markets
Brazilian equity markets had their best day since 2020 as investors expected Flavio Bolsonaro (son of the jailed former president) to become the next president and push through market reforms in a bid to lower the interest rate in the country from its current level of 13.75%. Bond yields fell and the currency strengthened. We like to see news like this because recently emerging market headlines have been dominated by the AI trade, with Taiwan and South Korea becoming more correlated with US equity performance. But there are many other countries and opportunities in the emerging market space. Many Latin American countries come with high political and local risks and to have positive returns depends not on the individual stocks but the economics of the country itself. However, this also diversifies where the return can come from.
Brazil’s interest rates are so high because its national debt is 80% of GDP and excessive public expenditure is driving this. Equity performance was short lived though, as in the end current leader Luiz Lula da Silva secured the victory. This just shows how tricky investing in emerging markets can be, with political forces often dominating returns. The macro environment can drive returns even if company fundamentals look strong. We expect Brazilian equities and bonds to be extremely volatile as investors unwind positions based on Bolsonaro winning.
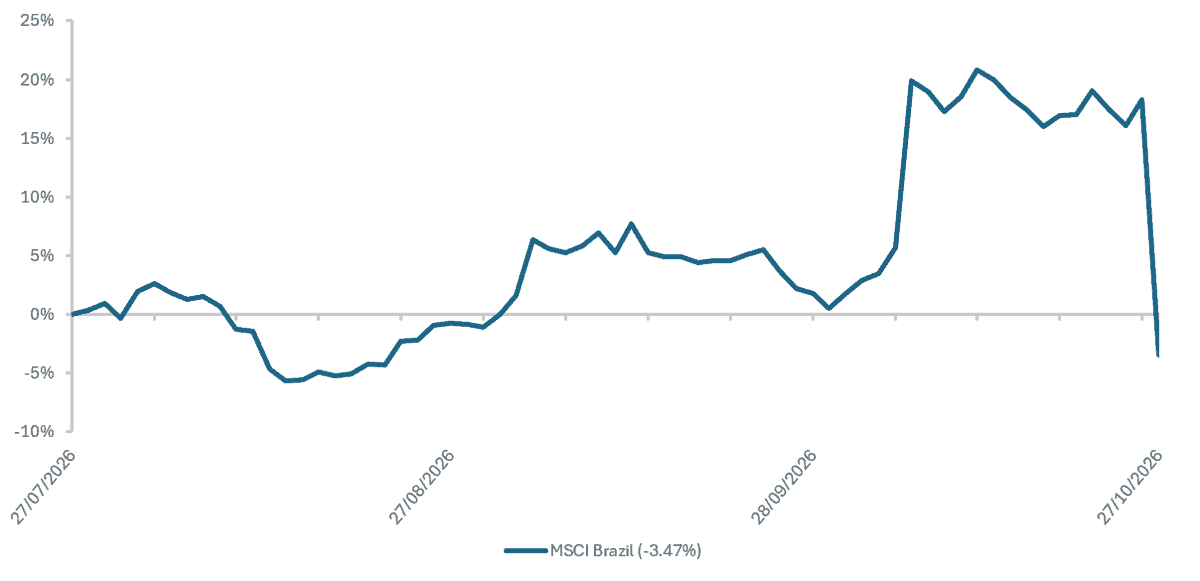
Chart showing the three month performance of Brazilian equities. (Source – Watson French with data from Investing.com. Return period runs from 27.07.2026 to 27.10.2026. Data correct as at 27.10.2026. Returns are based on opening prices in US Dollars). When the line shoots upwards the potential for Flavio Bolsonaro to win is high. It later gives up this gain and some when the election goes the other way.
While we see uses for index trackers, our preference has tended to be for actively managed funds as they provide better diversification and flexibility. A recent announcement by the index provider MSCI shone a different light on the indices that managers track. Indices are supposed to be objective representations of a stock market but they are inherently political. MSCI is looking at whether Indonesia should be downgraded from emerging market status straight down to “stand alone” status because of transparency issues and potential market manipulation. This would cause them to be removed from MSCI emerging market indices leading to capital outflows, higher borrowing costs and more limited access to international capital. Even active managers reference a benchmark, and positions are under- or over-weight relative to said benchmark. MSCI will often consult with outside investors on this as well, introducing conflicts of interest.
While this investigation is good, helping the local market to improve governance etc., it does bring into question how much control these index providers have over capital flows. It reminds us of SpaceX’s IPO earlier this year, when stock markets changed their rules to accommodate SpaceX as soon as possible. Our point here is that you need to be aware of what index you are tracking, what it includes and excludes. Indices include more political decisions than you may think.
–
Robert Dougherty, Investment Director
November 2026
This article is not a recommendation to invest and should not be construed as advice. The value of an investment can go down as well as up, and you may get less back than you invested. Data is correct at time of writing and cannot be guaranteed.