1st July 2025
With this in mind, things do not look too bad given all the that has happened. Investors like to see straight lines but markets do not often behave this way and so it is important to stay invested even during turbulent periods.
We are starting to see an asymmetric risk-return profile in markets. The risks from higher oil prices and higher tariffs are not being priced into markets. Most of the big tech sector has more than recovered all of its losses from the initial barrage of tariffs, despite not much changing. Earnings are still growing at a healthy clip but growth needs to be higher to justify present valuations, especially for Tesla. For this reason we continue to see opportunities in a diversified global portfolio and remain extremely wary of the downside risks in markets.
Markets continued the month pushing higher, ignoring the upcoming deadline for the temporary tariff reprieve on 9th July, although we have seen a flattening in returns lately. Markets climb a wall of worry, but what happens when they get to the top?
Markets are a perpetual capital allocating machine with no emotions. In this regard the consequences of the recent Israel-Iran attacks move numbers up and down in the market machine with no regard for the real consequences to the civilians on the ground affected by these attacks. Keeping this firmly in mind we will briefly mention why the conflict affects the remorseless market machine.
With the US bombing Iran’s nuclear facilities, markets are on edge for a few reasons. The first is that although Iran only produces around 5% of the world’s oil supply, around 20%-30% of oil travels through the Strait of Hormuz on a daily basis (21 million barrels per day according to U.S Energy Information Administration). With Iran controlling the northern part of the Strait there is a risk that they will close this off to shipping. Supply difficulties mean higher oil prices and higher oil prices feed directly into inflation and growth. This is one of the main risks of the conflict.
Transportation costs could also increase, causing further inflation in everyday goods.
Iran could also choose to attack oil infrastructure in neighbouring countries such as Saudi Arabia. This is not as big a risk as the Strait of Hormuz being closed because the OPEC+ cartel could simply increase supply to offset some of these production losses.
The second risk is a wider escalation of the conflict. Russia warned the US not to attack Iran and China is also somewhat dependent on oil produced in Iran. Geopolitical risk is rampant in markets but it is not something that can easily be quantified or forecast.
With all of this in mind oil prices have not moved much, relatively speaking. On 19th June Brent Crude oil prices reached just over $78 a barrel. At the time of writing on 26th June prices have fallen to around $66 a barrel. If we look back even one year ago prices were around $87 a barrel, and three years ago were $114 a barrel. Therefore it is reasonable to conclude that markets have not reacted much to events in the Middle East and are not forecasting much disruption. A jump to a much higher price (such as $120 a barrel) is the tail risk event and this would be a supply shock.
This month we also saw tariffs on steel imports increased to 50% by the Trump administration. Despite a jump from the original 25% markets mostly brushed this off. Steel is a very politicised industry and one which many countries impose tariffs on. Once the steel industry has disappeared from a country, it is very difficult to get it back up and running. Also, when steel plants close the layoffs are extremely noticeable, with thousands of jobs disappearing at once.
The UK saw interest rates held steady this month with the Bank of England governor Andrew Bailey saying ‘rates remain on a downward gradual path’. Despite weak economic growth inflation remains a key concern for the UK. Bailey also questioned the Office for Budget Responsibility assumptions for an uptick in UK productivity and cast doubt on various aspects of the UK economy.
The Swiss currency is seen as another safe haven for capital, and this has caused problems to the Swiss market. The Swiss Franc has appreciated by over 9% versus the US Dollar since the start of April, and this has caused inflation to dip into negative territory for May.
With a strong currency this has meant the cost of imports for the Swiss market have been less, pulling inflation down by 0.1% in May. The Swiss Central Bank reduced interest rates to zero again and yields on the shorter end of the curve have turned negative.
We continue to see debate about whether the US Dollar will remain the global reserve currency with some commentators saying the era of exorbitant privilege is over. We think the US Dollar is frayed at the edges but not broken. The US Dollar and US treasury yields have not been behaving as they should, with yields rising and the US Dollar falling, akin to what we see in emerging markets.
However, since the Iran-Israel conflict has intensified yields have fallen and the US Dollar index has picked up, possibly in response to a potential Federal reserve rate cut as early as July.
–
Areas of Focus
- Gold continues to be popular with Central Banks, as the yellow metal accounted for 20% of global reserves in 2024, second only to the US Dollar.
- The price of silver has also shot up in recent weeks, contrary to the belief that lower manufacturing and production would lower the metal’s value. Unlike gold, silver is mainly used for manufacturing purposes.
- Swiss interest rates were reduced to zero, with short term government bonds yielding negative returns.
- Oil prices have increased this month but have since given up much of these gains. Volatility remains high.
- Technology companies continued to break new ground, with Nvidia threatening other big tech companies hold over the cloud computing space. Nvidia remains up around 14% this year to date.
- Smaller companies continue to lag their large cap counterparts in the UK and the US this year. One-month performance for UK companies has been better, outperforming the large caps by 3.24%.
- US value and growth companies remain in step for the year, but over the last month growth has outperformed value, putting pressure back on growth valuations.
- Global government bond yield curves have steepened, with investors demanding higher premiums for holding long dated debt.
- High yield bonds continue to deliver positive returns, with US high yield spreads up over 4% YTD but still tight relative to historical levels.
–
Asset Class Returns
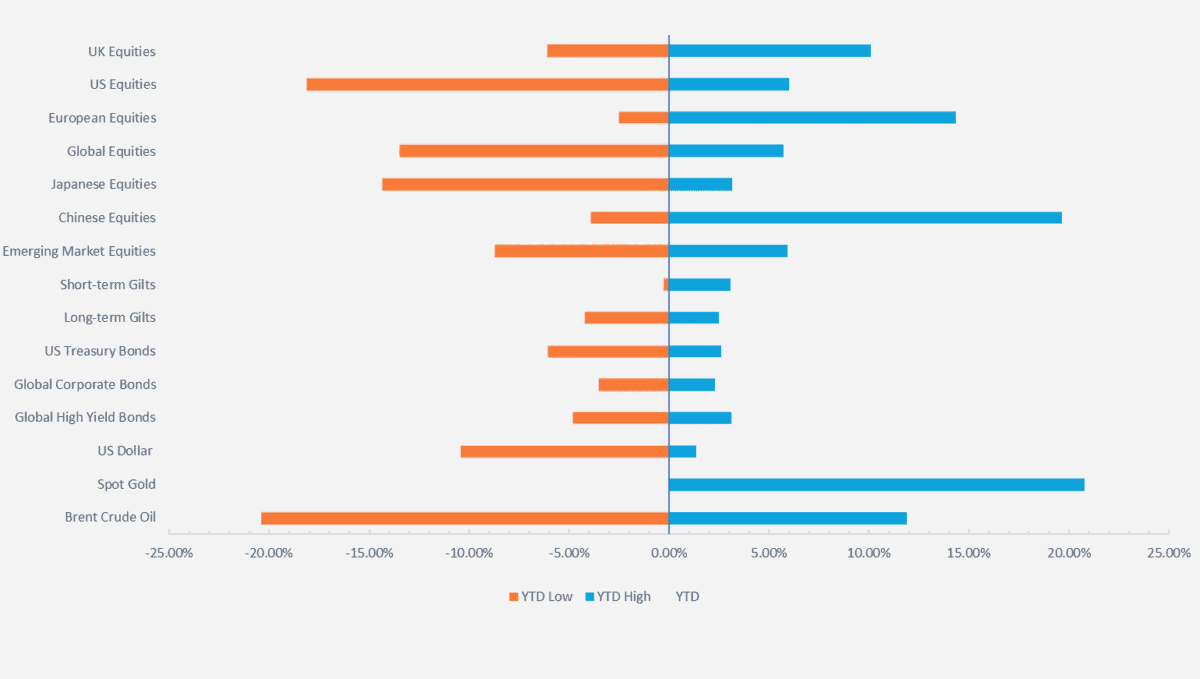
Selection of assets 2025 YTD returns and range of returns as at 26/06/2025 (the two ends of the bars represent the range of YTD returns and the red dots represent the current YTD return). Indexes used: FTSE All-Share, Russell 2000, STOXX Europe 600, MSCI China, MSCI Japan, MSCI Emerging Markets, FTSE UK Conventional Up To 5 Years, FTSE UK Conventional Over 15 Years, ICE BOFA US Treasury, ICE BOFA Global High Yield, ICE BOFA Global Corporate, US Dollar Index, S&P GSCI Gold Spot, S&P GSCI Brent Crude Spot. Returns hedged back to GBP with exception of US Dollar which is in US Dollar terms. Data from FE Analytics and MarketWatch
–
UK
Before we get onto the gloom for the UK market, some good news. The FTSE 100 has continued to climb higher this year, briefly touching a record high level of over 8,800. The large cap FTSE 100 has continued to lead the way with financials and banks delivering strong returns of 24% and 15% respectively.
We saw excitement in oil giants BP and Shell share prices as the WSJ reported rumours of Shell approaching BP for a potential takeover. Shell disputed this and under UK takeover rules, Shell would have to wait six months before it can approach BP after denying the claims (as a side note, these are the types of rules which make the UK a more difficult country to do business in!).
Automobile companies continued to hold their gains for the year owing to the respite in the higher tariffs the sector faced from the US. The biggest winner this year has been defence companies, with the FTSE All Share Defence sector up over 57% YTD, and up 6% over the past month. Globally defence companies are expected to have a boost to their earnings as major economies are under pressure to increase their defence spending to 5% of GDP.
With a Price to Earnings (P/E) ratio of 35.5 for the sector, well above the three-year average of 25.6, a lot of the earnings growth may have already been priced in.
Smaller companies have started to pick up with returns firmly in positive territory for the year. Over the long term the FTSE AIM 100 is in deeply negative territory (eight-year returns are still down over 15%).
Commentators are concerned about the FTSE AIM with listings at a 20 year low of 700 companies and the UK a hot spot for M&A activity, low valuations and a lack of UK listing appeal may cause this market to shrink further, especially with the IHT advantages of investing in the AIM market now much reduced. The average market cap of the AIM is £100 million – these small and micro sized companies will have felt the weight of high interest rates and the recent increase in minimum wage and employer National Insurance Contributions will not have helped. Any improvement in economic or monetary policy should give these companies a helpful boost.
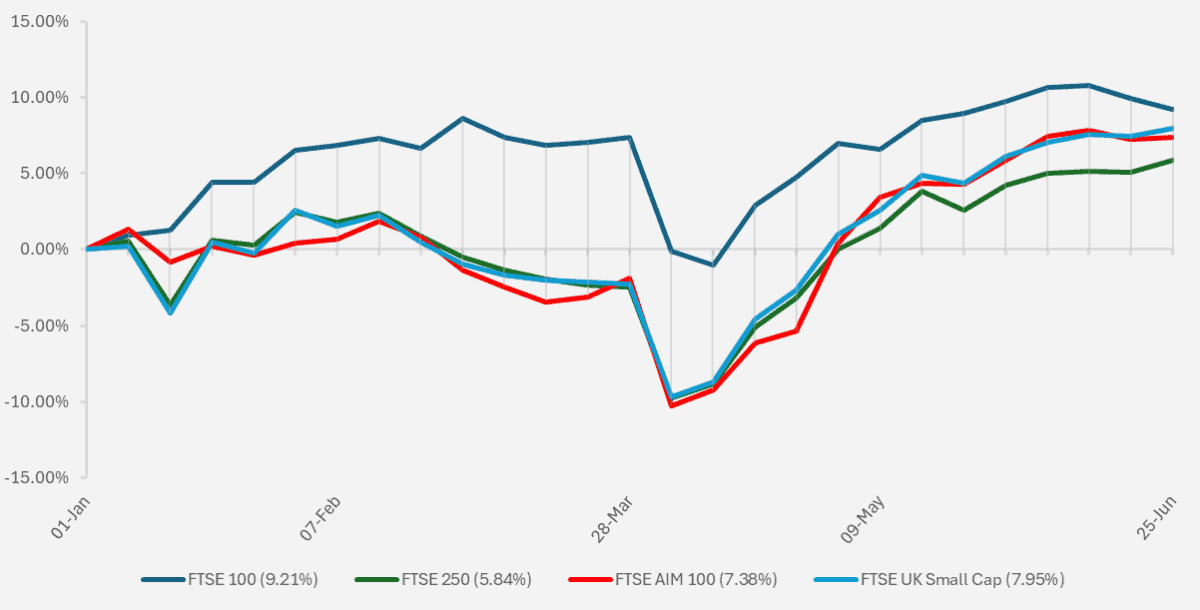
Chart showing YTD performance of UK FTSE Stock Market Indices (Source – Watson French with data from FE Analytics).
The strong performance of the UK market is clear evidence of the disconnect between a domestic economy and its stock market. Most of the revenue generated by the FTSE 100 companies comes from overseas, and a lot of that is service based – financials and banks. But also a lot of it is energy and commodities-based, such as mining companies. The strong performance of the FTSE 100 is also promising given the pound has strengthened against the US Dollar this year, which generally weighs on company earnings.
As at the end of March the FTSE 100 had a forward P/E ratio of 11.24, much lower than the S&P 500 which has a forward P/E ratio of 21.10. In a higher interest rate and slower growth environment it is these lower duration stocks that tend to hold up better (by lower duration, I mean companies whose earnings are already growing and not priced out far in the future, as would be the case with a technology company or an immature AI company). As we mentioned last month the quality dividend growing companies are in favour at the moment and a lower P/E ratio is typical of these companies.
We have talked for months (if not years) about the problems facing the UK market, and despite the levers for growth being in place, the right people just do not want to pull them. Like its European counterparts, the UK is stuck in consultations and regulations which are making the UK uncompetitive for new IPO listings and putting a discount on UK stocks, making them prime targets for private equity firms to take over.
In 2024, 88 companies delisted from the UK stock market, with only 18 companies taking their place. So far this year more companies have been taken private than there have been new listings.
UK pension funds hold on aggregate just 4% their asset allocation in UK stocks. The UK pension industry has over £2 Trillion in assets under management and as of February 2025, the UK stock market had a value of £4.65 trillion. Even a small flow from overseas assets and into UK equities for UK pension funds should give the UK market a boost. Do not hold your breath though – like mainland Europe, regulation and bureaucracy mean things do not move quickly here, and this discussion has been going on for years.
So far this year UK equities have had a very strong year, but despite positive net inflows into UK equities, it has mostly been from overseas rather than domestic investors.
Is it up? No, yes… well maybe. With meagre growth of 0.2% in GDP for March, hopes were high for consensus-beating growth in April, but alas, this did not materialise. GDP contracted at 0.3%, below analysts’ expectations for a 0.1% contraction. The services industry fell by 0.4% as higher National Insurance and minimum wage costs weighed on the industry.
Unemployment also rose and wage growth slowed in April to 5.2%, slightly below expectations.
Inflation came in at 3.4% in May, with services inflation slowing but still high at 4.7% (a decline from April when services inflation was 5.4%).
Traders had thought a slower economy could prompt the Bank of England to cut rates twice this year but based on the split voter base at the last Monetary Policy meeting and higher than target inflation this still looks unlikely in our view. The recent inflation data will poor cold water on the probability of more than two rate cuts this year as the bank focuses on keeping inflation from rising.
The problem with the UK relative to the US in this respect is the US is economically stronger and has more wiggle room than the UK. Recent inflation data will contain some effects relating to the recent minimum wage and employer’s National Insurance increases. In the coming months this could lower inflation as businesses lay off workers to save on costs, or could push inflation higher as businesses increase prices to pass on higher costs. With the UK consumer especially sensitive to inflation and price increases, the former looks more likely and should prompt more rate cuts, rather than fewer.
Further to this there are serious concerns about the quality of the information coming through from the Office for National Statistics. Recently there have been errors found in past measurements which will have affected GDP data going back years. The head statistician for the ONS has recently stepped down and even recent inflation data came in wrong, as the Vehicle Excise Duty Data was incorrect. This resulted in inflation being overstated by 0.1% for April, which is not being revised by the ONS.
Considering Central Banks are looking for the smallest signs to be able to cut rates, these errors raise serious concerns. The labour force survey the ONS uses for lots of its data is being seriously questioned in regard to its accuracy, as the number of respondents has dropped considerably. Response rates for the end of 2024 were just 19.6%, up from a low of 12.7% in mid-2023. If the ONS is only receiving 19.6% of its intended sample size, that sample simply cannot be considered representative of the population.
Previous internal emails from within the ONS showed that for one survey the ONS had just five respondents, and the reduction in survey size for one industry caused the data point to move by 30%.
There have also been problems with the trade data being reported and the producer price index data. The ONS had planned to replace its faulty job data by November… 2026, or possibly even 2027. The fact that the ONS head Sir Ian Diamond stepped down despite testifying in front of MPs regarding the ONS, and previously seemed more determined to improve the ONS, shows the mountain of improvement needed.
The UK Statistics Authority (yes, that is a real authority!) has been called to investigate the ONS and provide options for government action for the ONS.
–
Europe
Markets often talk about generating alpha, which is the excess return for the risk taken – essentially outperformance. In the US it is much more difficult to generate alpha because of the high level of analyst coverage of stocks in the region. Markets prices are based on information and if this information is readily available to all, it should be quickly reflected in the stock’s price.
Research by Goldman Sachs Asset Management points out that US stocks have a market-cap weighted 41 analysts covering them compared to 25 analysts for Europe (and 27 for Emerging Markets – this just shows how unpopular Europe has been). Their research also shows that each US company has an average of 36 news articles on it, compared to just 14 for Europe.
This means that information is not as readily available in Europe as it is in the US and this gives active investors opportunities to generate outperformance.
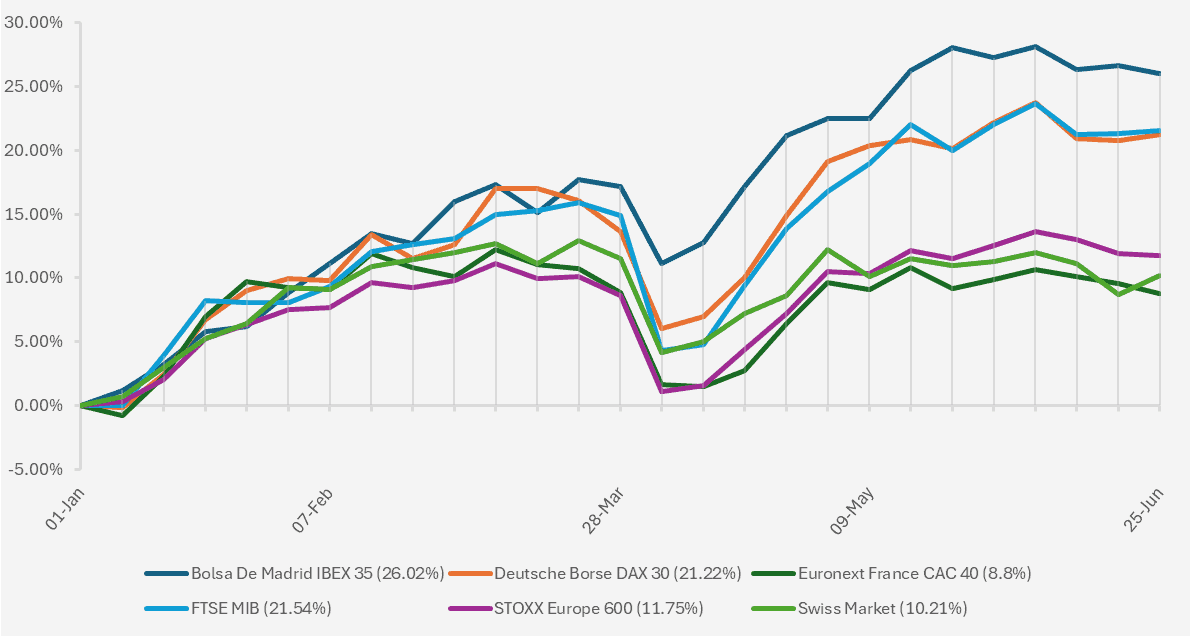
Chart showing YTD performance of major European stock market indices (Source – Watson French with data from FE Analytics. Returns hedged to GBP).
Performance over the year has still been positive for the major European markets, but we have seen relatively flat performance in June, likely due to investors holding in anticipation of what might happen after 9th July when the tariff pause runs out. Investors are closely watching the Swiss market to see what (if any) action is taken regarding the strong currency and resulting negative yields on some government bonds. The concern is that any interference in the currency market by the central bank may be viewed by the Trump administration as currency manipulation and result in some sort of penalty.
Like the UK, European defence companies have rocketed this year, with the MSCI Aerospace and Defence index up 51.57% YTD. While some of the other strong sectors have lost some ground this year, the index is still in positive territory. In times of conflict and remilitarisation defence companies do particularly well as this is when the demand for their products increases. The resulting earnings growth from the trend to 5% of GDP defence spending will not be evenly distributed, with US companies supplying the most advanced weaponry to Europe. The EU will need to make sure this spending is directed towards European companies in order to feel the full benefits.
Any supply chain disruption will also likely cause further headwinds for defence companies, but overall, the outlook is still trending up for earnings. That said, much of this may already be priced into stock prices and any backtracking on defence will result in losses.
Another interesting country to examine in Europe is Ireland. Despite having a GDP value just 1.9% of that of the US, Ireland had a trade surplus with the US of over $52 billion. Most of this is because a lot of pharmaceutical companies have set up manufacturing and head offices in Ireland in order to take advantage of generous tax breaks. We will look at this in more detail in the next asset commentary.
The French market has remained subdued relative to its neighbours in part because France has an unsustainable debt level with no plans to do anything about it.
European government bond yield spreads over the German Government Bunds continue to narrow, as German yields have increased in anticipation of the German infrastructure and defence spending plans. In March Germany announced a 1 trillion Euro spending package including exempting defence spending from the constitutional debt brake. A senior member of Germany’s finance agency recently said that the era of Bund scarcity was definitely over. Forecasts point to this spending increasing GDP by 0.5% up to 1% over 2026.
This is a good sign for the bloc if they wish to proceed with issuing a common EU debt load. There has been more interest in joint Euro debt issuance recently, with investors becoming wary of the US Dollar and the American privilege (the US issuing debt in large quantities at low yields, with foreign holders picking up the slack by reinvesting their trade surpluses in the US).
One of the problems with issuing a common debt is that less risky countries such as Germany will pay a higher borrowing cost than if they had issued the debt themselves. However, we have seen Euro yields relative to German government yields narrow in the past month which could be supportive for a joint bond issuance. Research suggests that issuing a joint bond would benefit many of the individual countries in the EU, lowering the interest they would otherwise have paid by issuing on their own.
As I mentioned in last month’s commentary, the joint market would still likely not be deep enough to absorb the liquidity needed, and with Gold becoming an ever more popular asset the EU may have missed its chance already.
–
Japan
All of the focus lately has been on the US and its growing pile of debt, but the Japanese economy has been running with a national debt level of over $8.7 trillion. That is nearly 240% of the GDP level and up from a level of 70% in 1998.
With pressure mounting on the US over its planned fiscal deficit, why has Japan got off so lightly over the past few decades, and why does it have so much debt in the first place?
Japan has a high debt level mainly because of its ageing population and its weak economic growth. Over the past 25 years, the average annual GDP growth rate was just 0.64% while the average CPI inflation rate has been 0.43%. The current percentage of the population over age 65 was around 30% in 2024, and this is forecast to increase further. At the start of the century this figure was 17%. For comparison purposes the UK has 18% of the population over aged 65 and the US has 17.5%.
With a total population estimated to be 123 million people, that’s 36.9 million people over age 65. Compounding this problem is a falling birth rate. Per 1,000 people there are just six births, down from a high in 1973 of 19. People are also living longer, with an average life expectancy of 85.27, up from 81.08 in 2000. In summary, people are living longer, birth rates are declining and the proportion of people over 65 is increasing. This means that there will be more pressure on people of working age to pay for a large population base of retired people who are also living longer.
Interestingly, over the medium term we have seen changes in production to reflect this population shift – more diapers produced for the elderly rather than babies and private equity companies buying funeral companies.
A large proportion of Japan’s annual spending is on social security and with less consumers in the workforce fiscal receipts are not high enough. An ageing population is not just a problem isolated to Japan but a global problem and one which will affect asset values over a long period.
The answer on why Japan has been allowed to have so much debt is complicated, but a few of the reasons are as follows.
The cost of financing this debt has been extremely low due to the deflation that has long plagued the country. When the financing costs are low the amount spent on servicing this debt is not concerning. Since 2006 the yields on the two, ten and thirty year Japanese government debt reached maximum yields of 1%, 1.9% and 2.9% respectively, and did not move above this level at any point.
Compare this to US government debt where the maximum yields on government bonds for two, ten and thirty years since 2006 have been 5.1%, 5.1% and 5.2%.
Interest costs on Japan’s debt account for around 1.7% of GDP, much lower than many other developed economies pay. US debt costs are already around 3% of GDP.
Foreign holders of government debt account for just over 6% in total. One of the biggest holders of Japanese government debt is the Bank of Japan itself, which holds 52%. The bank often holds this to maturity, meaning that there is no “mark to market” of the debt value. The bank has meaningful control of the yield curve and does not behave like a bond vigilante driving up yields. For the US around 33% of the US debt is held by foreigners.
The interest and redemption payments on Japan’s debt is therefore essentially the left hand giving to the right – that is, the central bank lends the government the money and receives it back from them, circulating internally.
Data from the St. Louis Federal Reserve consolidated Japan’s Central and local government balance sheets with other government agency balance sheets to show that the net public liabilities (liabilities less assets) amount to 78% of GDP. This is because at the time of writing, the consolidated balance sheet had assets totalling 192% of GDP.
Furthermore, these assets are invested in domestic and foreign equities as well as bonds, where the liabilities consist of bank reserves and government bonds. The return on the assets should be greater than the return on the liabilities, creating a spread between the two categories and meaning that assets grow faster than the liabilities. The overall effect on the balance sheet is therefore a positive one. Therefore even though debt has increased significantly, the net debt has not.
Another point is that Japanese consumers have an average savings rate of 9.10%, while Japanese corporates hold a lot of cash on their balance sheets rather than paying it out. Japanese consumers and businesses are therefore well insulated with a lot of cash to invest.
With so much debt in the economy and the main holder of this debt, the Bank of Japan, now running down its holdings, someone has to buy it otherwise yields will go up further. With domestic Japanese institutions happy with their asset allocations to Japanese government bonds and looking more likely to reduce their long term bond holdings, foreign investors are needed to pick up the slack. If debt levels stay high and foreign holders increase their holdings, this could lead to bigger volatility in the market.
Recent reports suggest that the Bank of Japan plans to reduce its issuance of long term 30 year debt and this has helped calm the 30 year bond yield, which had spiked over 38% to the end of May. Global long term debt is coming under pressure from investors. One reason is that investors expect economies to continue to issue debt in larger volumes. If the demand is not there for the debt then the price will fall and this is reflected in prices today. Also, with increased financing costs servicing these debts become more cumbersome.
Over the long term we may see steepening yield curves and the effect this will have on equity markets is to increase the risk premium investors demand (lower returns) and increase overall volatility.
Japanese stock markets have remained mostly flat this year, recovering from their large decline from the April tariffs fairly quickly. Similar to Europe Japanese equities remain in a holding pattern, likely awaiting clarity on 9th July (the end of the US tariff pause) to offer some direction to markets.
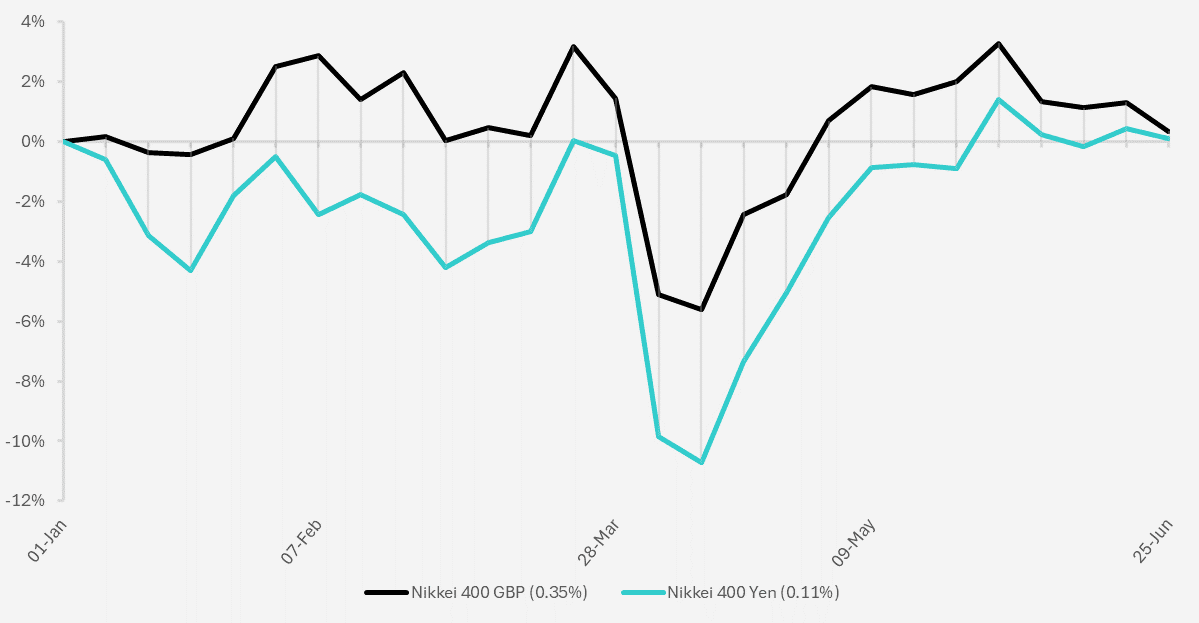
Chart showing YTD performance of the Nikkei 400 stock market index. The black line shows the return hedged to pound sterling and the blue line shows the return in Japanese Yen (Source – Watson French with data from FE Analytics).
Still, corporate reforms and world leading advances in robotics present compelling long term opportunities for the market.
–
US
Have you recently left the administration? Do you wish you were back there? Do you have feelings of rage? Do you feel you have too much debt? Then maybe you have Trump derangement syndrome(!).
According to President Trump ‘people leave my administration and they love us. And then at some point they miss it so badly. And some of them embrace it. Some of them actually become hostile. It’s sort of Trump derangement syndrome’. The month started with some drama as Musk and Trump, who for the past few months enjoyed a marriage of convenience, let their marital troubles spill onto the web as the two exchanged blows in disagreement to the tax bill Trump is trying to push through. While the exchange took place shares in Tesla slid around 14% in heavy trading as Trump threatened to cut Musk’s government subsidies and contracts.
While this may seem like silly drama, it is important for markets. It shows that if business leaders stand up to Trump there are consequences. He may threaten their businesses with penalties for disobedience and drive their share prices (and personal wealth) down. One of the owners of Walmart recently spoke out against Trump, risking backlash for the company. If you are thinking this sounds like something that would happen in China then you are forgiven.
As the two major superpowers collide over trade and materials, they are becoming closer in nature than they may realise – think bans on exports of semiconductors, threats to allies of tariffs for ‘bad behaviour’, or reneging on ‘deals’. The National Guard were recently called into Los Angeles to combat the protests over deportation efforts in the region, something we would not expect from a lawful and free market.
The outcome of this is that confidence to invest in US assets and for businesses to associate themselves with the US may deteriorate. We saw this several years ago when the Chinese government cracked down on regulatory concerns with businesses and foreign money flowed out of China.
Investor confidence in a region does not disappear overnight but can be gradually chipped away over time. One of the most important functions a major economy needs to show is that is has a rule of law. If investors believe this is in doubt, then markets will fall. If law does not exist, how can businesses sustainably operate?
From legal threats to law firms and universities to threats to take away business contracts, the US is looking less attractive while Europe is doing its best to make the region more accommodating.
It may seem implausible that the US will not be the world’s best and biggest stock market in the future, but in 1989 the Japanese stock market was the biggest in the world – the price-weighted Nikkei 225 index reaching a level of 38,915. It took until 2024 for the index to reach this value again (that is 35 years!). Since its crash in 1989 returns have been pretty poor and the index has increased by just 3.17%. For comparison, over the same period the S&P 500 increased by 1,964%. In annualised terms the Nikkei 225 underperformed by 9.02% pa.
For a brief period this year the MAG 7 turned into the LAG 7. While many of these big companies have regained the ground lost, Apple, faced with issues over its AI rollout and Chinese supply chain, has not.
Over time the global leaders in the stock market can and do change and we often forget about some of the previous biggest companies.
This is not to say that these companies will not grow in the future, but expectations need to reflect reality. What do I mean by this? Take Nvidia for example, with a current market cap at the time of writing of $3.54 trillion and a five year growth in stock price of over 1,500%. If the stock grew by this same level over the next five years, it would be worth over half of the current global GDP level – that is over $56 trillion in value. Maybe one day it will reach this value, but this is long term investing.
As an investor it is important to constantly question your thinking and beliefs. Things do change and investor psychology leads us to believe it won’t. Our recent term of the week on the behavioural bias of anchoring is important here. All of this is to say in a long-winded way that we expect equity returns and growth to broaden out to a greater range of companies and industries. The environment for an active stock picker is abundant with opportunity.
The Trump administration has seen this month that imposing tariffs and expecting everything to work is not that simple. One of the main goals of the administration was to reshore manufacturing and one key area for this was automobiles. But the rare earth magnets that are needed to manufacture cars need to be imported, and who is the biggest exporter of these? China, of course. The US was sent scrambling to negotiate over these metals with China, otherwise car manufacturers said they wouldn’t be able to produce any cars in the US. So if China doesn’t grant the licences on a reliable and continuous basis then these companies may need to assemble more of their products overseas.
Another negative effect of Trump’s policies revolves around Nvidia and the export controls on its chips to China. In simple terms, if Nvidia cannot sell chips to China then its revenues will be lower, and it will have less to spend on advancing its chips and staying ahead of the competition. Nvidia is at least one generation above Huawei in terms of chips development, but the Chinese company is making progress and Nvidia may not be top dog forever.
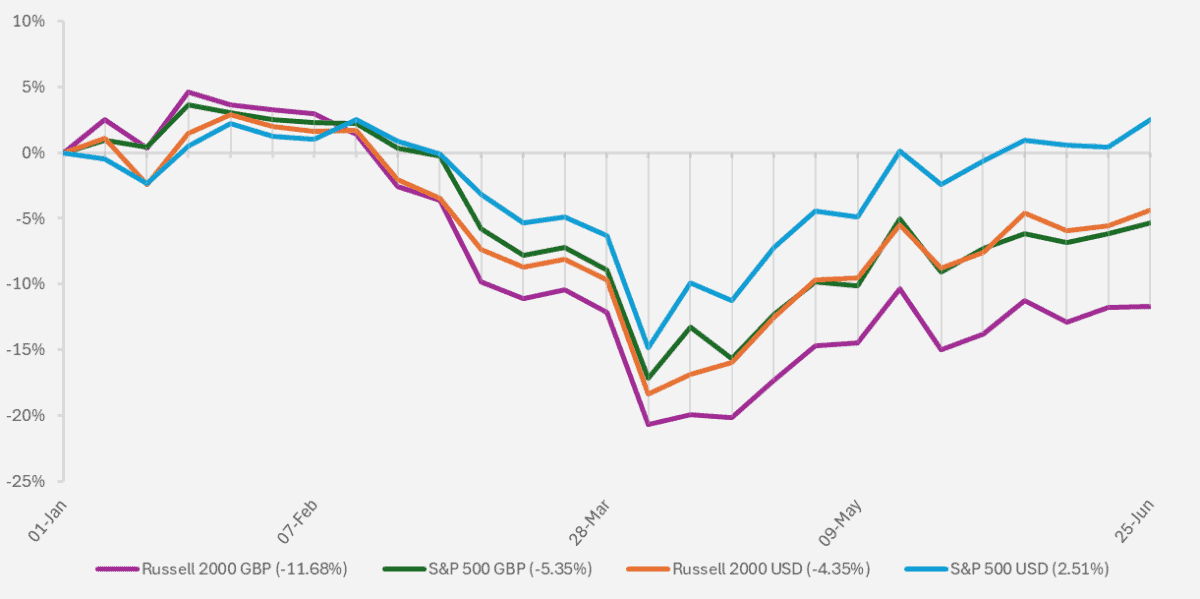
Chart showing YTD performance of major US stock market indices in Pounds sterling and in US Dollars (Source – Watson French with data from FE Analytics).
The major US stock market indices have moved higher since the pause on tariffs, but for an unhedged UK investor they still have not regained all of the ground lost. For a US Dollar investor or a hedged UK investor in the S&P 500, returns are just above flat for the year.
Since the start of the year the pound has strengthened against the dollar by 9.6%. When the pound strengthens it takes more US dollars to buy one pound. Therefore for an unhedged investor whose underlying holding in the US market is denominated in US Dollars, they may have made positive returns on the underlying share price movements (as we can see in the US dollar-denominated return above), but when they convert their dollar holdings into pounds, they will lose money as their US dollars will buy less pounds. This is also a problem for global companies which generate their revenues in different currencies. Each company will generally hedge its revenues in some way but it can result in mark-downs in their overall profit levels if currencies move against them.
Currency markets are complex and driven by many dynamics. The pound has strengthened on the basis of a few points: interest rates may remain higher than expected in the UK, general confidence in the US dollar has waned over economic policies and the US currency has weakened in an effort to reshore manufacturing.
I should also note here that most of the return in the S&P 500 has come from the largest Mag 7 companies, where Tesla has been replaced by Broadcom.
Inflation as measured by CPI in the US came in softer than expected in May at 2.4%, higher than the 2.3% recorded in April. This was still below analysts’ expectations, which were for 2.5%. The core inflation figure (which excludes food and energy prices, which tend to be more volatile) remained the same from April at 2.8%.
This is undoubtedly a good sign that inflation has not picked up but in all probability, it does not reflect the tariffs yet and we will continue to see their effects in the coming months. I say in all probability because we just don’t know how much of the tariffs will be picked up by manufacturers and importers, and how much will be passed onto consumers. At the end of the day someone has to pay the tariffs.
The Federal Reserve held its borrowing rate at its current level, which the market had fully expected. There is divergence appearing among Federal Reserve members, with some forecasting two rate cuts this year and some forecasting none at all. Federal Reserve members Christopher Waller and Michelle Bowman have recently turned their attention to the upcoming Federal Reserve Chair job as the present chair Jerome Powell’s term expires May 2026. Both members have pointed to their interest in a rate cut at the next meeting. Now, whether this reflects their genuine views on the economy or whether they are trying to appeal to Trump for a new job next year is uncertain.
In any case, the economy and the labour market are both still strong, but cracks are appearing. The Fed’s rhetoric is that they have time to wait and the cost of waiting is small. Only time will tell on this matter but we expect rates to be held at the next Fed meeting.
–
Robert Dougherty, Investment Specialist
July 2025
This article is not a recommendation to invest and should not be construed as advice. The value of an investment can go down as well as up, and you may get less back than you invested. Data is correct at time of writing and cannot be guaranteed.