1st May 2026
The longer the war continues, the longer the risks of demand destruction build. What we do know is that pressure on both markets and consumers is increasing. The UK as always (don’t worry, I do write something positive about the UK later on!) is suffering harder than many other developed economies, as it is an energy importer for both businesses and consumers.
In some areas we see this as a double hit – the UK is highly dependent on importing jet fuel, importing over 9 million tonnes in 2025. Australia imported 6.4 million tonnes and the US exported 4.1 million tonnes.
As we approach the warmer summer months this could also hit tourism both in the UK and overseas as the cost of flying remains high. Airlines tend to hedge out some of their fuel costs, but they are quickly running out and for companies like Wizz Air, they have been targeted by short sellers as the increase in fuel costs will likely wipe out their profits. In March the short interest in the stock increased from 8.5% to 13.5%.
The Bank of Japan voted to keep rates at their 0.75% target. They forecast slowing growth and rising inflation, although inflation is expected to reach 2.8%, nothing of the magnitude we saw in western countries in 2022. The Bank of England also held rates steady with one dissenter voting to increase rates by 0.25%.
Markets were given some clarity as the Department of Justice dropped their criminal investigation into the current US Federal Reserve chairman Jerome Powell, opening the door for the new chairman Kevin Warsh to receive Senate approval. In his Senate confirmation hearing Warsh said that Trump did not try to get him to promise lower interest rates in his appointment to the role. We certainly hope this is the case but not saying this would be a shot in the foot, and so was to be expected. We look to see whether his rhetoric changes when he starts in his post and how the first Federal Reserve Open Market Committee goes under his leadership. Jerome Powell has chosen to stay on for the remaining time as a governor, stopping Trump from keeping on Stephen Miran as a voting governor in an attempt to preserve Fed independence. In the latest Fed meeting they also voted on keeping interest rates at their same level but four members dissented, with three voicing concerns over the rhetoric towards easing monetary policy.
We are in a strange place with the war in Iran. Equity markets have continued their push higher, with the NASDAQ Composite index posting its longest winning streak in five years and most global equity markets still positive year to date. We have seen earnings growth in the US and a general optimism around continued returns. This is all despite increased commodity prices. Emerging markets in particular have recovered extremely strongly, although this is driven by big technology related stocks in Asia, highlighting the concentration of the emerging market indices. Countries such as India, Indonesia and South Africa have been hit particularly and the broad rally hides this. In the bond market we have not seen this positivity, with government bond yields still elevated above their pre-Iran war levels.
Bond markets are more cautious than equity markets because their return profile is asymmetric. The upside is limited and downside is 100% (equities’ upside is potentially unlimited) and so it could be a case of waiting to see what the effects of the conflict will actually be. It could also be that bond yields were too low coming into March and they have reverted closer to the level they should have been at anyway. We see the arguments for both and believe the answer lies in the middle. Long term structural drivers such as changing demographics and ageing populations are going to keep upward pressure on yields. Regardless, should we start see demand destruction we will likely see both asset classes reverse course.
Other than oil and gas companies, the biggest beneficiaries of the recent gains in stock markets have not been the big technology companies but those involved in the construction of datacentres. We see some signs of struggles in the bond markets related to certain technology companies’ debt. Recent reports have detailed how long it has taken for investment banks to offload the debt from some companies’ recent bond issues to the wider market. Credit default swaps on technology company debt have also risen, as investors price in more risk in the sector. As we look at in the UK equity section, we just don’t see how all of these companies will generate enough revenue to reward their capital investments.
As we continue to monitor the private credit industry, a recent article in the Financial Times reported that UK pension funds will face huge charges if they try to sell down their private assets, with potential transaction costs of 10% along with discounts to the net asset value. Data showed that just over 14% of defined benefit scheme assets are invested in private equity, property and alternatives. Liquidity looks at how quickly an asset can be sold, what volume can be sold, how much it costs to do so and how close to the expected value something can be sold for. Private assets are illiquid and the costs of selling something only goes up when demand is lower. With the government pushing private assets onto defined contribution schemes we think this will greatly increase liquidity risk across the board.
–
Areas of focus
- Technology stocks have performed strongly following their initial decline in March. While big tech has performed well, other companies such as those involved in data centre construction have done better.
- Oil and gas companies could continue to see big increases in earnings should the supply of commodities remain restricted from the Middle East. The energy market is cyclical and earnings can quickly change.
- Defence companies initially rose during the war but later pulled back their gains as markets continue to believe the conflict will not be drawn out.
- Government bond yields remain elevated, in particular in the UK where fiscal concerns and increased debt issuance remain a concern. Political risks could push yields higher.
- US high yield bond spreads have continued to fall after their jump in March, showing markets are not pricing in much risk from the conflict.
- Core European equities have continued to lag periphery countries as they include a lower proportion of banks and financials, which have performed well.
- Japanese bond yields continue to rise as interest rates look set to increase to control inflationary pressures.
- The US Dollar has given up some of its initial gains since the start of March and remains broadly flat through the year. US interest rates may fall while European rates pick up, causing some selling of the Dollar.
–
Asset Class Returns
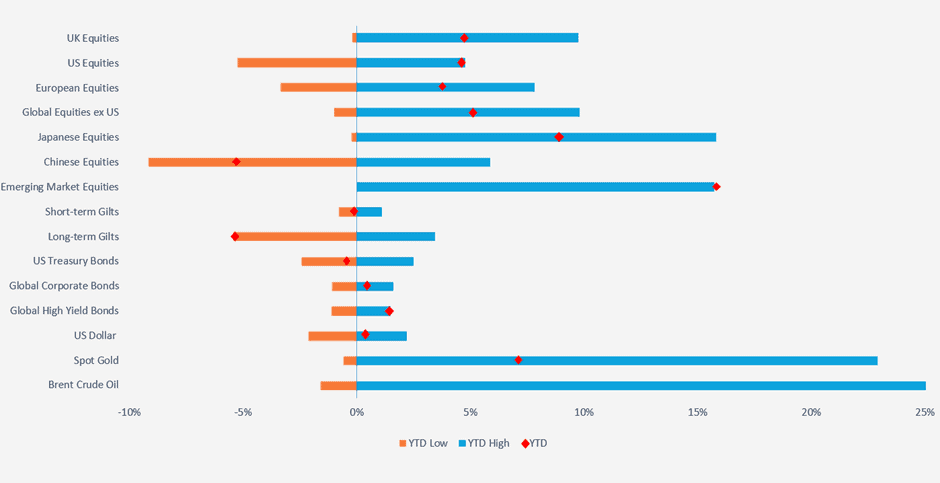
Selection of assets 2026 YTD returns and range of returns as at 27.04.2026 (the two ends of the bars represent the range of YTD returns and the red dots represent the current YTD return). Indexes used: FTSE All-Share, Russell 3000, STOXX Europe 600, MSCI World ex USA, MSCI Japan, MSCI China, MSCI Emerging Markets, FTSE UK Conventional Up To 5 Years, FTSE UK Conventional Over 15 Years, ICE BOFA US Treasury, ICE BOFA Global Corporate Hedged GBP, ICE BOFA Global High Yield Hedged GBP, US Dollar Index, S&P GSCI Gold Spot & S&P GSCI Brent Crude Spot. Returns hedged back to GBP with exception of US Dollar which is in US Dollar terms. Returns based on daily data. Source – Watson French with data from FE Analytics and MarketWatch. Data correct as at 27.04.2026). The YTD point for Brent Crude Oil is not shown as its YTD return is 88.20% and including this would distort the chart too much.
–
US
Inflation rose in March, jumping from 2.4% in February to 3.3% in March. This is the highest level in two years and we are starting to see a trend building upwards. Despite this, markets still expect some rate cuts from the Federal Reserve this year, and this has limited the rise in the value of the dollar. Much of the rise in inflation has been driven by the increase in oil prices, despite the US being an oil exporter. We can see this by looking at core inflation, which removes food and energy prices (which tend to be more volatile). Core inflation was 2.6% in March, rising 0.1% from the previous month. In the US prices at the pump rose by 21.2% in March which consumers will be very cognisant of approaching the mid-term elections.
While we have spoken about the disconnect between how consumers say they are feeling and what they actually do, it is still important to monitor this as trends do change. The University of Michigan’s consumer sentiment index fell to a record low of 47.6. This was down from a reading of 53.3 in March.
You wouldn’t expect to see a statement such as “the Nasdaq composite index has had its longest winning streak in five years” with a war going on and a supply crunch in energy and commodity markets, but the Nasdaq has powered higher throughout this. Earnings season is also expected to be a good one with an aggregate rise in earnings. The narrative is clearly that markets think the Strait of Hormuz will reopen in the future and energy will flow again, but also tax cuts in the US have helped to give consumers more income to spend or save, and businesses are optimistic coming out of the tariff-dominated regime. Prolonged higher oil prices will weigh down on this optimism.
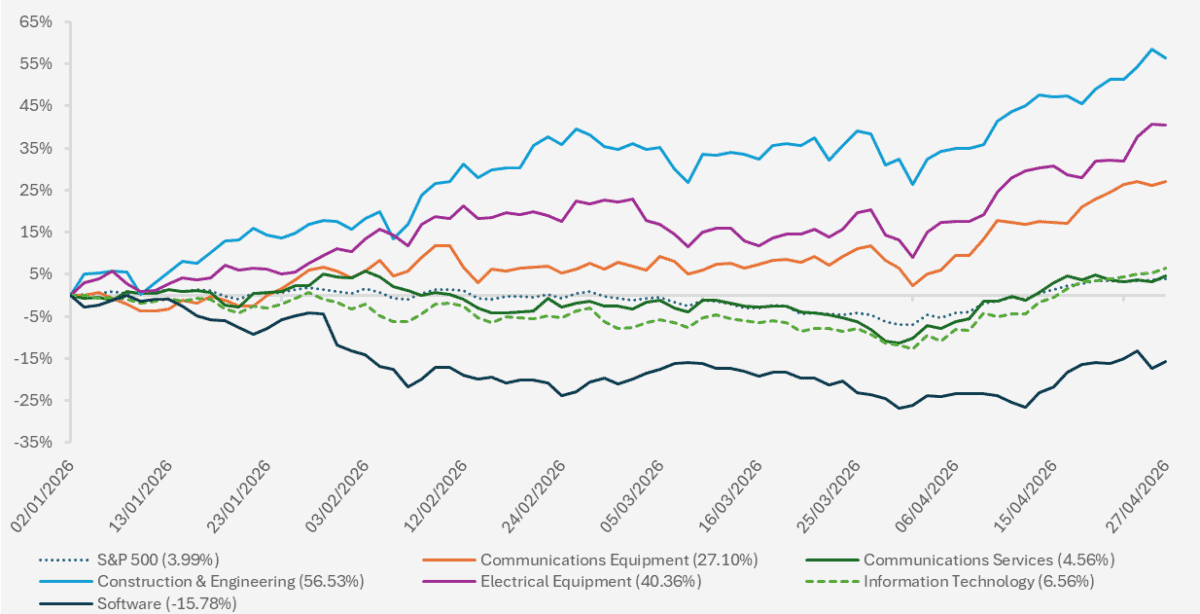
Chart showing the year to date performance of the S&P 500 and a selection of S&P 500 sectors and industries. (Source – Watson French with data from Investing.com and Marketwatch.com. Data correct as of 28.04.2026 and based on daily opening prices. Returns are in US Dollars).
The chart above picks some of the sectors potentially involved in the AI theme, both through development of AI models (information technology and communications services), construction of data centres (the equipment and construction sectors) and, depending on your outlook, the implementers or losers of AI (software), and looks at their year to date performance. The S&P 500 has been pretty flat for the year, but as we noted last month, the dispersion between sector and individual stock performance has been large.
What we have seen is the sectors more exposed to building the infrastructure of AI (datacentres etc.) have performed very strongly this year. The question is, is this a short term rotation or a longer term theme? Looking at the longer term data, these sectors have been outperforming over the past three years and as long as the AI theme remains strong and there are not improvements in technologies resulting in lower power consumption and a lower demand for data centres, we expect growth to remain strong. Whether they support current valuations is another question.
This is also important because the construction of the AI infrastructure is giving a boost to the labour market at a time when the growth from immigration has essentially reduced to zero. Immigration has been a huge driver of the US labour market growth over the past decade and longer. Should the AI theme fizzle out it will be more than just the equity market that takes a hit. That being said, when the initial development of AI infrastructure starts the labour needed is high. But when it is finished and the data centres are up and running the labour needed to run them falls right down.
Software has been hammered all year long. Investors are still punishing companies in the sector as they are deemed most at risk of being replaced by AI. Over the past decade investors favoured asset light businesses such as Apple and Microsoft, but the new trade is in HALO stocks – Heavy Assets, Low Obsolescence.
One area we are watching is the use of stablecoins as this is becoming more prominent in the US. A stablecoin is a digital currency whose value is pegged to a traditional fiat currency such as the US Dollar and is backed by liquid and high quality assets such as currency, money market instruments or short term government debt. The biggest stablecoin globally is Tether. When a consumer wants to buy stablecoins, they will pay the issuer their traditional currency. The issuer will take the currency from the consumer and will exchange it for stablecoins. The issuer will invest the traditional currency into high quality assets.
Stablecoins can be used to quickly transact across borders with low to no costs and can be used to buy cryptocurrencies. Why we care about stablecoins is because of how they interact with treasury markets and the risks inherent in how they are backed.
Stablecoins received a big push through the Genuis Act in the US which gave a federal regulatory framework for the asset. It defined things like who can issue one, what the reserve requirements are and whether interest can be paid or not. The key point in this act was that holders of stablecoins will not be paid any interest under this framework. Stablecoin issuers are pushing back on this as it will be a big reason for people to continue hold money in traditional bank accounts rather than in stablecoins. Stablecoins are effectively competition for banks’ capital and so banks are pushing back against the framework.
This matters because if stablecoins are allowed to pay interest, consumers will likely go to the one that pays the most interest. In turn, this will push stablecoin issuers to invest in riskier assets to pay this interest. These issuers have regulatory oversight but the regulators only see the companies and their reserves when they ask to. This introduces the risk of investing in riskier assets without the regulator knowing.
We are interested in how this will affect the US Dollar currency and how central banks will be able to use monetary policy to control interest rates and inflation. It will also be important to see how the treasury market reacts. If the fiat currency goes into the treasury market this could increase demand for short term debt, bringing yields down. But in a market scare we could quickly see yields rise if consumers want their fiat money back.
This is a very recent development and one we will be looking at over the years to come.
–
UK
The UK economy grew in February by 0.5%. This is good for the UK economy as it means it had entered March on a stronger ground than previously thought, as the rise in energy prices and commodities will likely have a negative impact on economic performance in March. The majority of the growth came from the services industry, while construction has continued to be a drag on growth since October 2025. The risk for the UK is still a stagflationary environment, where growth is low and inflation is high. Research suggests that for every 10% rise in energy prices, the UK GDP growth is lowered by an average of 0.1% to 0.2%.
When the war in Iran started markets had priced in four quarter point interest rate rises for the year; this has now dropped down to just one. We still think even one rate increase is unlikely. The Bank of England voted to hold rates at 3.75% but under the surface some members thought the bank should act early to stop inflation from rising. Like we said last month, raising interest rates will do nothing to the price of energy and will only look to anchor wages and cause businesses to lift prices.
As promised I look at the UK in a more positive light for a change. While the UK equity market continues to fall down in global importance, with the Taiwanese stock market now having a greater value than the UK market (the UK market is valued at around $4.09 trillion versus $4.13 trillion for Taiwan), this is fairly misleading. A single company, TSMC, makes up 58% of the Taiwanese market as represented by the MSCI Taiwan index. The UK has a lot more companies in its listings (even if more and more are disappearing) and the top ten companies in the UK make up just under 45% of the FTSE All Share index (soon to be less when AstraZeneca moves its primary listing). On one hand it does show how the UK is missing out on the growth in the technology sector, with technology and communication services accounting for just 3.74% of the FTSE All Share.
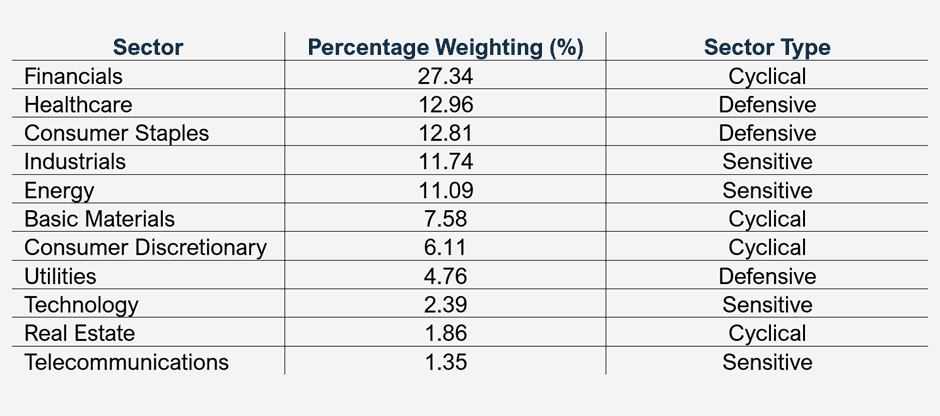
Table showing the sector breakdown in the FTSE All Share Index. Total exposures for Cyclical, Sensitive and Defensive sectors are 42.89%, 26.57% & 30.53%. (Data from LSEG/FTSE Russell. Data correct as at 31.03.2026).
But we don’t necessarily see this as a bad thing though for a few reasons and rather than beat on the UK we want to look at why UK equities still represent good opportunities. First of all, the UK index is fairly broad with a good spread of companies in different sectors (for reference the S&P 500 has around 56% in sensitive sectors with 43.50% in technology and communication services). This means there are opportunities to build a portfolio for different environments and the index isn’t reliant on any one outcome. If we look at the US S&P 500 it is heavily weighted to technology companies, which relies on the AI structural theme continuing.
UK markets are light on technology companies and this is good. This may seem a strange point because it is these AI companies that the market values highly, and we have just said the UK market is falling behind because it lacks them. But if we look at the economics of the AI buildout it can paint a different picture.
The big AI technology companies such as Alphabet (Google), Meta, Microsoft, Anthropic and OpenAI (to name a few) have been training and building the AI models and investing in the infrastructure in order to sell something other businesses and consumers can use. This is essential to get the ball rolling but it is a huge cost for these companies. Spending on AI is expected to reach $800 billion this year alone, and this will continue in the future. This spending needs to repaid through revenue and profit, and there will only be so much revenue to go around.
Some estimates put the amount of revenue needed at well over $4 trillion dollars a year starting in 2030. To put this into perspective the Magnificent Seven companies generated a combined $2.2 trillion in revenues in 2025. This seems very unlikely given the current trajectory and spending by businesses on AI. We do not even mention overseas competitors such as companies in China, nor the increased cost of energy, memory or other equipment needed to run and train AI models. Quantitative tightening by central banks and any potential shrinking of the Federal Reserve balance sheet by the new Fed Chairman Kevin Warsh also put this into doubt (less money in the economy means less spending).
These businesses also need to do something that makes them different from one another, otherwise revenue will be shared between them or businesses will fail to secure demand and cease to exist. Not everyone can be a winner and with higher costs comes with the need for higher revenues. The UK doesn’t have this problem, as we don’t have any of these big AI spenders. Where we do see value is through the types of businesses that the UK does have implementing AI into their operations, improving productivity and earnings.
This is where the UK can stand out. I think the market is still underappreciating just how much AI companies are spending and how much profit they will need to generate to make a return on their investment over the long term. An example we could look at is supermarkets utilising AI to improve ordering and reduce waste. The UK may lack technology companies but it doesn’t mean it won’t benefit from the improvement in technologies. If we look back at the buildout of the railway system, it is clear that other companies that could use the railways to deliver goods benefited more than the railway companies themselves.
When we look at how AI could be used, it could replace or improves tasks rather than jobs. This will make doing a task cheaper and when a task gets cheaper, the demand for the job increases – this is known as the Jevons Paradox. Certainly for professional service jobs this is expected to be the case. If the cost of the work falls the addressable market expands and the demand grows, increasing the number of businesses and works in that sector. The UK being a services based economy should see strong benefits from this. For example, when steam engines were developed and the use of coal became more efficient, the UK did burn less coal it burned more.
Historically, compounded income has produced the majority of long term returns, not price growth. The UK has a large range of healthy dividend-paying companies. Investors may be caught up in the momentum price growth but at some point, income will become vogue again.
UK government bond yields continue to remain elevated, relative to other global economies and to where they were one year ago (see chart below). The UK is dependent on its energy imports and is a heavily service-based economy. The UK government could step in to support consumers with their energy bills, but any support will be funded by debt which will put further upwards pressure on yields and could cause higher rates later down the line.
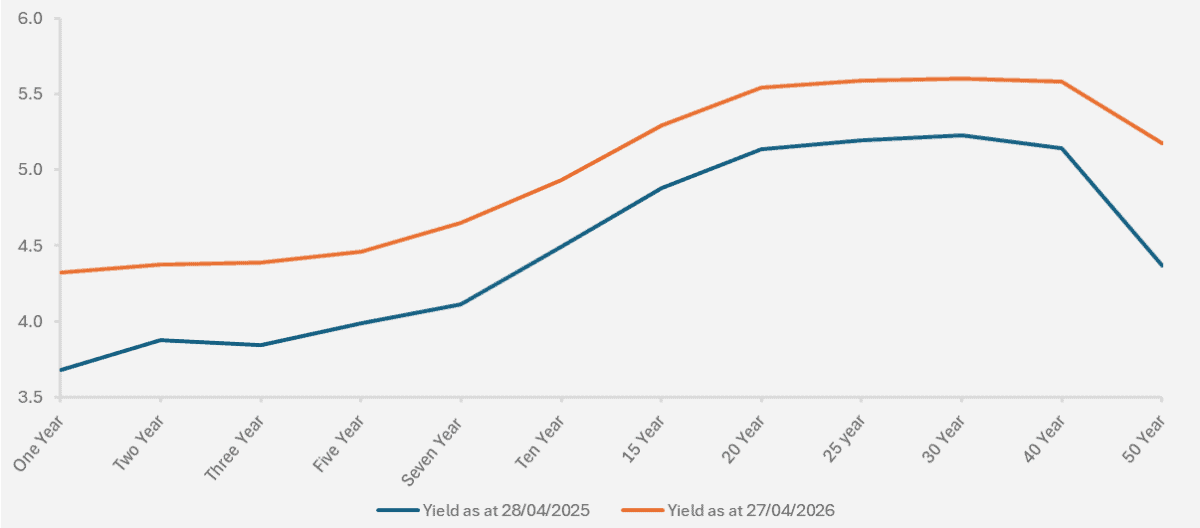
Chart showing the UK gilt yield curves as at 27.04.2026 and one year earlier at 28.04.2025. (Source – Watson French with data from Investing.com. Data based on daily opening yields and data correct as of 27.04.2026).
The yield curve has risen and become flatter which indicates that markets expect shorter-term rates to rise. A flatter yield curve can happen as markets expect change in the economic data and it is therefore in a holding pattern. The change in the two year yield from a year ago is 12.88%, and for the ten and thirty year yields the change is 9.72% and 7.23% respectively.

Chart showing the year to date performance of various FTSE All Share sectors. (Source – Watson French with data from Investing.com. Data based on daily opening prices and data correct as at 27.04.2026).
Higher yields and more volatility in the markets will continue to help banks and other financial companies, which make up the highest proportion of any sector in the FTSE All Share index. Deregulation will also help these companies but will add more risk into the system. Banks have to hold a certain amount of liquid and ‘safer’ capital depending on what risky assets they hold. With higher rates of returns on risk-free assets, this could help with banks’ net interest income
In the US regulators are looking to reduce the regulatory burdens on banks and we will likely see the UK follow in their footsteps in some way, in order to keep UK banks competitive.
–
Europe
Europe, like the UK, relies a lot on imported energy and so has suffered in a similar manner as the UK. One major difference between the two is the starting point for inflation. In Europe inflation started the year at 1.9% and the latest reading for March came in at 2.6%. Inflation is clearly starting to rise above the European Central Bank (ECB) target of 2% but it is much lower than the UK inflation rate of 3.4% in March.
But markets may be more concerned with the direction of travel rather than the actual number, and within the bloc there is variance between individual countries. This is also true for individual equity market performances (see the chart below).
In France CPI has picked up from 0.3% at the start of the year to 1.7% as of March. CPI in Spain is presently at 3.4%, having started the year at 2.3%, and German CPI has picked up from 2.1% to 2.7%. The ECB interest rate has been held at 2.15% for nearly a year now and pressure is picking up on a rate increase to slow down any potential inflation.
This comes at a time (similar to the UK) when growth is positive but still weak. In 2025, Italian and German GDP growth was just 0.5% and 0.2%. Growth in Spain and France was better at 2.8% and 0.9%. Increasing interest rates will put pressure on growth and encourage consumers to keep more money in cash savings, where the savings rate has been high relative to the US. In the US the latest data shows consumers save around 4.5% of their disposable income in cash, compared to 14.4% in Europe.
The core European countries, France and Germany have seen pretty flat returns from their equities over the past year, while periphery and emerging countries have actually done pretty well. When we look at what makes up each index it becomes a bit clearer on where performance has comes from.
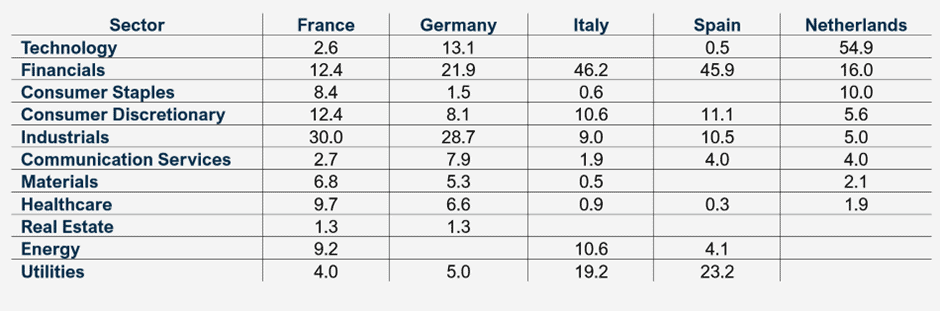
Table showing the sector breakdowns of European equity markets. (Source – Watson French with data from MSCI. Each country is represented by an MSCI Index. Figures may not add up to 100 because smaller allocations are not included. Data correct as at 31.03.2026).
Spain and Italy have performed well because they have a much higher exposure to financials which have benefitted from higher interest rates (although they are lower now, and this will have been somewhat of a drag on their net interest income) and a picking up in loan growth. They may well benefit from an end to the war in Ukraine in the future as the reconstruction needed in the country will be huge and will require a large volume of loans. Furthermore, although not all of the actions proposed in the Draghi report have been implemented, as more of them are followed through this should help growth which will benefit banks. A big risk for banks in Europe is the deregulation in the US. Banks are globally competitive and less strict regulations in the US will allow these banks to outcompete European banks.
Europe loves its red tape and regulations, so deregulation looks unlikely (look at Switzerland and the recent proposal for UBS to increase its Common Equity Tier 1 capital by $20 billion as an example). But they are aware of the competition and recent proposals put forward for more mergers in European banks will help – the bigger the bank the lower its cost of capital and the better its reach. European banks tend to have lower valuation metrics relative to US banks and with improvements in operations they could close this gap. In the US some commentators state the Merger & Acquisitions market is mid-way in its upwards cycle. If this spills over into Europe then banks in the region will also benefit.
The Netherlands is the unique country in the above table in that 54.9% of the MSCI index is in the technology sector. Of this 48.10% comes from one stock, ASML, the semiconductor equipment manufacturer. This is similar to Taiwan in its index concentration. Over the past year ASML has gained over 110% pushing the MSCI index much higher. At a forward P/E ratio of 41 the stock looks expensive.
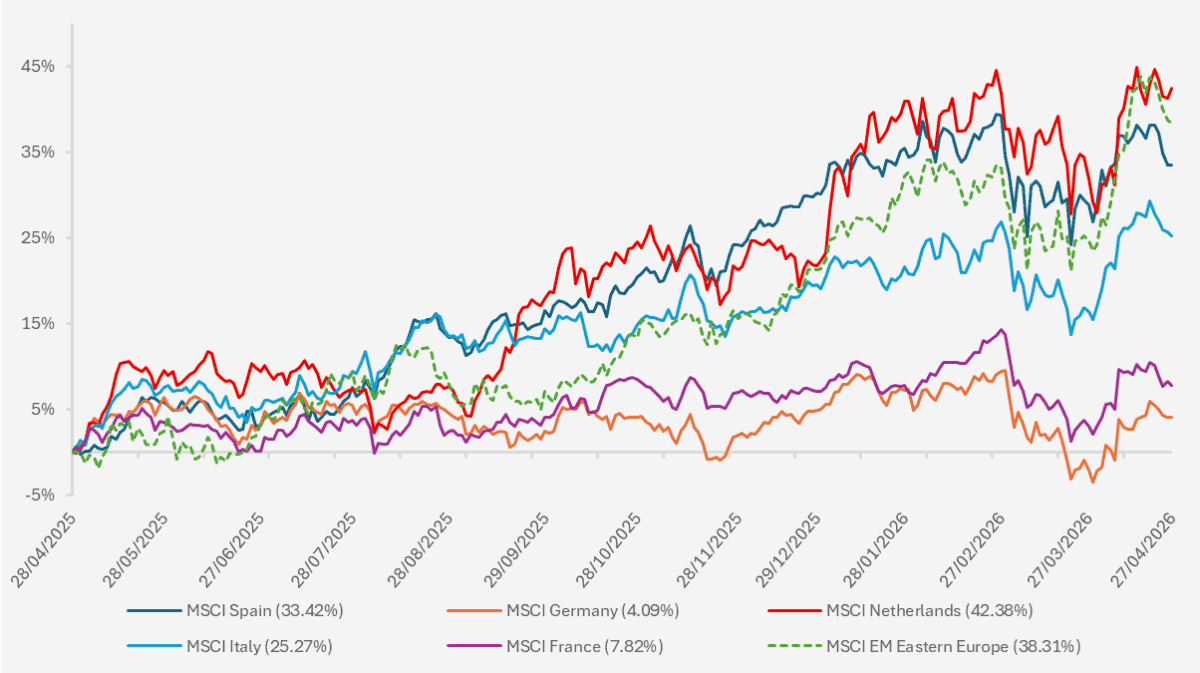
Chart showing the performance of a selection of European equity indices over a one year period. (Source – Watson French with data from Investing.com. Data based on daily opening prices in Euros and data runs from 28.04.2025 to 27.04.2026. Data correct as of 27.04.2026).
Germany and France have been the laggards with their lower exposure to financials and higher industrials exposure. Both are heavily reliant on importing energy, which will act as a drag on corporate earnings for big manufacturers. There is a lot of variance in the underlying exposures of the indices and some countries will benefit from AI more than others. But there are also risks in each country, with the main obvious risk being ASML in the Netherlands. Similar to memory chips, we see this as a very cyclical stock with its earnings varying with demand for AI products. Google for example recently announced a research paper which showed a lower need for memory. Something will eventually come and replace the equipment AMSL manufactures.
We reiterate here that Europe is a very broad region and active exposure helps to capture more of the long term returns available. There is technology exposure in the region but Europe provides exposure to other long term structural themes such as increased global conflict (think increased defence spending benefitting companies such as Rheinmetall in Germany). A country’s economy is not the same as its stock market and so despite economic concerns there are opportunities in the stock market. With a lower volume of analysts covering European stocks and lower media coverage, we still see plenty of opportunities in the region for active managers.
–
Robert Dougherty, Investment Director
May 2026
This article is not a recommendation to invest and should not be construed as advice. The value of an investment can go down as well as up, and you may get less back than you invested. Data is correct at time of writing and cannot be guaranteed.