1st June 2026
This is evident if we look back through even recent history. The bond market pushed Liz Truss out of office, Donald Trump was forced to backtrack on his tariffs because the bond market didn’t like it, and the bond market may well put pressure on Japan should Prime Minister Sanae Takichi push too much spending and tax cuts onto the economy. Emerging economies’ bond markets are also putting pressure on the respective governments given their need to support consumers with the rising energy prices. The bond market is the electricity grid that makes the financial and economic markets work, and when the bond market doesn’t like something, it lets us know quickly and without remorse.
With this in mind, the war in Iran continues. Energy and commodity prices remain high and inflation pressures build, but global equity markets continue to push higher, even as bond yields remain elevated. Given enough time, businesses and consumers will feel the increased energy costs and the higher bond yields make their way through the economy. The question is, if energy prices remain higher and thus bond yields are higher, how long can the equity market ignore this?
We have of the biggest IPOs investors will see in their lifetime coming this year we will see how far equity markets can stretch. We could see selling in other areas as the fear of missing out creeps in. We look at the SpaceX IPO later on.
When we look at equities, under the surface there is an increasing divergence in performance with equities tied to the AI theme outperforming those reliant on imports from the Middle East (see emerging markets below). The longer inflation remains elevated and the longer bond yields remain higher, the more pressure there will be for the AI theme to drive markets. But even AI companies are not immune to increases in commodity and energy prices, and chip prices will likely increase leading to potentially even more capital expenditure by the bigger tech companies on AI.
In Europe markets are pricing in three interest rate hikes to control the building inflationary pressures, but no cuts are expected in the US. The US dollar index has remained broadly flat through the year. Initially at the outset of the war the US Dollar strengthened, but it has since been tempered by the expectations for a divergence in interest rates.
The UK bond market hit some shaky ground as the political risk premium rose and bond holders’ concerns over future Labour fiscal responsibility increased. UK government bonds provide an attractive income but there is no doubt that the volatility has picked up. We discuss this later in the commentary.
Last month we also touched on the concentration of the Taiwanese stock market and we think it is a good time to look at this again, given the recent divergence in performance between the broad emerging market index and the Indian equity market. India has been hit particularly hard since the war in Iran started with investors pulling money out of the stock market in large volumes. India imports 90% of its oil and gas and is the third biggest global energy importer. This has put pressure on the Indian Rupee at a time when Indian exports have been impacted by last year’s US tariffs. But if we look at the broad emerging markets index it has performed much better, and much of this is driven by Taiwan and South Korea whose exports of AI related technology have helped to offset some of their energy increases.
Emerging markets had been a diversification trade away from the US AI trade for some investors, but with technology accounting for 36% of the MSCI Emerging Markets index and the top three stocks in the index being TSMC (14.21%), Samsung Electronics (6.03%) and SK Hynix (4.05%) it is becoming more and more reliant on how the AI trade performs. Expectations for US equity earnings growth for Q1 was 28%, and data from Blackrock put the growth in MSCI EM tech earnings at over 160%.
As has become tradition as of late, we take another poke at private credit. We spoke a few months back about the failure of a UK bridging loan company called Market Financial Solutions amid fraudulent activity. Early in the month the FT reported that HSBC, a major global bank, disclosed a $400 million fraud-related charge in their latest earnings. The bank states that it didn’t lend directly to the failed company, and yet it is still suffering a huge loss because it lent to private credit firm Apollo which did lend to the company. It is these “second order” connections which are causing concern. It wouldn’t have been possible to see what exposure HSBC had to some of the private credit borrowers and instead we can only find out after the fact. Banks may not have direct exposure to private credit but they certainly have indirect exposure. JP Morgan are looking to offload credit risk linked to their NAV Loans to private credit firms, prompting regulators to question whether this will end up increasing the amount of leverage in the system.
We mentioned in a previously commentary about the possibility of inflation picking back up (as was happening in Australia) and that perhaps interest rates would not fall back down as markets thought. While this has played out in some way it doesn’t mean we were right with our crystal ball, that we were predicting this or that we changed portfolios because of it. We don’t trade based on market news or short term economic news and we could have just as easily have been wrong. In this market environment diversification is an essential ingredient to positive outcomes and portfolios need to be built to live through events, not to react to them.
–
Areas of focus
- Global government bond yields have risen since the war in Iran started, with UK Gilt yields looking particularly shaky given recent Labour party losses in local elections.
- Shorter dated government and corporate bonds continue to look more attractive than their longer dated counterparts, offering lower interest rate risk and an attractive income.
- With the upcoming SpaceX IPO and potential listings from Anthropic and OpenAI, equity markets’ ability to absorb these listings will be tested. We expect to see increased volatility and dispersion in performance ahead.
- Chinese onshore equities have outperformed offshore equities as technology companies in the offshore indices drag on returns.
- Emerging market performance is increasingly being driven by a handful of AI related stocks, increasing the concentration of the indices and withering away the diversification emerging markets were originally offering from the US AI trade (at least in terms of passive investing).
- Unlike in the UK, US smaller companies continue to outperform larger companies.
–
Asset Class Returns
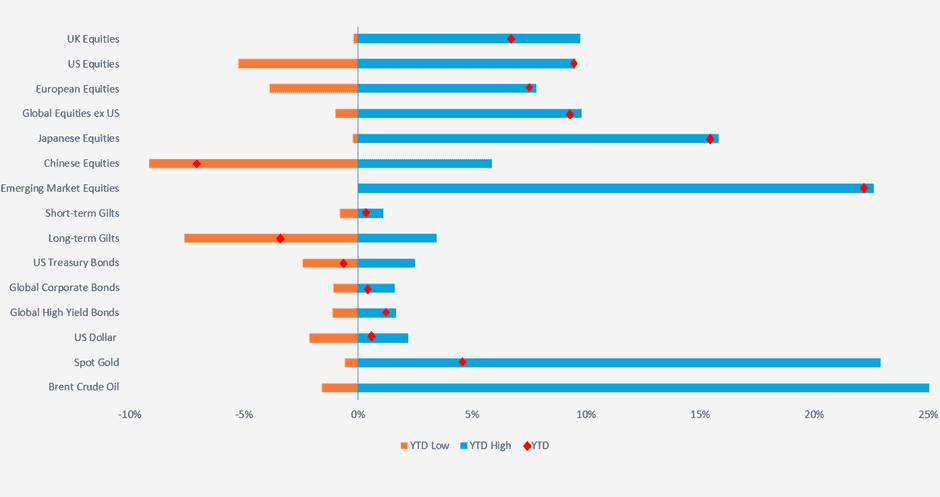
Selection of assets 2026 YTD returns and range of returns as at 22.05.2026 (the two ends of the bars represent the range of YTD returns and the red dots represent the current YTD return). Indexes used: FTSE All-Share, Russell 3000, STOXX Europe 600, MSCI World ex USA, MSCI Japan, MSCI China, MSCI Emerging Markets, FTSE UK Conventional Up To 5 Years, FTSE UK Conventional Over 15 Years, ICE BOFA US Treasury, ICE BOFA Global Corporate Hedged GBP, ICE BOFA Global High Yield Hedged GBP, US Dollar Index, S&P GSCI Gold Spot & S&P GSCI Brent Crude Spot. Returns hedged back to GBP with exception of US Dollar which is in US Dollar terms. Returns based on daily data. Source – Watson French with data from FE Analytics and MarketWatch. Data correct as at 22.05.2026). The YTD point for Brent Crude Oil is not shown as its YTD return is 98.42% and including this would distort the chart by too much.
–
US
The employment data in the US came in at with 115,000 new jobs added and unemployment remaining at 4.3%. Some investors are taking this to mean the trend will continue and the Federal Reserve will now focus on the inflation part of their mandate. We think this is still too early to conclude and the longer the war in Iran drags on the more pressure we will see on the labour market.
As we mentioned in our introduction, equities tied to the AI buildout have continued to outperform, but also economies tied to the buildout have performed strongly as well (see South Korea and Taiwan). US GDP growth rose to 2% in Q1, up from 0.5% for the last quarter for 2025. When we look at where the growth came from it is from the consumer, government spending and private investment.
Trade was a drag on GDP but this includes the goods imported from overseas by companies investing in AI, i.e. memory and semiconductors. Private investment grew at an annualised rate of 8.7% in Q1 and contributed 1.5% to the overall growth rate. Consumer spending was still strong at an annualised rate of 1.6%, but it did cool from the previous rate of 1.9%. Tax cuts from Trump’s Big Beautiful Bill last year have boosted the consumer and will provide some support throughout the year, but recent data showed how little the US consumer is currently saving and thus how small a cushion they have against any financial stresses. As of March data from the St Louis Federal Reserve measures the saving rate at just 3.9%, indicating consumers may be borrowing more to continue their spending. If interest rates stay higher the pressure on repaying this debt will build.
US CPI inflation rose to 3.8% in April, moving further away from the Fed’s 2% target and an increase from the 3.3% rate recorded in March. Core CPI (stripping out food and energy) was 2.8%, up from 2.5% in March. Some notable parts of the inflation figure are airline fares which rose 20.7%, fuel oil which rose 54.3% and gasoline which rose 28.4% (having been negative the month prior).
Producer inflation also rose to an annualised rate of 4.3% in March and this will likely feed through into the consumer inflation picture in the coming months.
Kevin Warsh was confirmed as the next Federal Reserve chairman and now has a tricky job of whether to push for lower rates or hold them as they are. As someone Trump has just picked, he has the difficult task of staying out of the media headlines for Trump abusing him verbally in some way, and following the right path to meet the Fed’s mandates.
This year will be the ultimate test for market optimism, with several once-in-a-lifetime IPOs from private companies in line for later this year. We got an early taste of how the market is feeling when US company Cerebras Systems had its IPO with the initial offering priced at $185. The share price subsequently shot up to $385, before settling down around the $300 mark (at the time of writing the share price has fallen to $256). Cerebras is a technology company involved in AI chipmaking.
Anthropic, an AI leader, is also expected to IPO this year alongside OpenAI. Anthropic recently completed a funding round for $30 billion which valued the company at $900 billion, up from a valuation of $350 billion just three months prior.
All investors are eyeing the IPO of SpaceX later in the year, which is looking to raise $75 billion, giving the company a valuation of over $1.75 trillion. SpaceX is an extremely exciting company at the cutting edge of technology with its reusable rockets and dominance over rocket launches, accounting for 80% of global launches in 2025. But there are concerns around the company and its IPO which we believe investors are ignoring.
The IPO would be the largest IPO in history, ahead of the current record of Saudi Aramco’s IPO which raised $29 billion at a valuation of $1.7 trillion in 2019. The question is, can the market absorb this value at a time of market highs and with other popular IPOs potentially coming later this year? Investors may want to use dry powder not yet invested but it could also cause movements in other shares as investors look to sell investments to free up capital. Equity indices have rules on when a new share can be included in the index, and the Nasdaq index is looking to change these rules to get SpaceX included as soon as possible. For passive index funds (depending on how the IPO performs) they would need to buy shares at possibly expensive and high prices, the opposite of buy low, sell high.
Retail investors are big fans of Elon Musk and hold a lot of Telsa shares, and their participation could push prices very high. We would not be surprised if trading was temporarily halted on the day of the IPO.
There are governance concerns around the company with Musk controlling most of the B shares, which have ten times the voting power of the normal share class. He currently holds over 40% of SpaceX shares. The issue here is that Musk can only be removed as CEO and chairman by B shareholders, of which he will own most of them. These are clear governance concerns and for any other company these would be huge warning signs. But investors are so keen to get exposure to the company and the space industry that they are ignoring these issues. What happens if investors disagree with a course of action Musk or the board is taking? The processes to question and correct these are weak at best. Investors will have very little ability to influence shareholder matters at the company.
One interesting point and something we have not seen before is that Musk’s recent pay package would see him given 200 million class B shares, and is contingent on the value of SpaceX growing to $7.5 trillion, but also a 1 million strong human colony being established on Mars. We look forward to seeing who the first Martians are and perhaps this asset commentary will come from off-world one day!
The point with this section is to highlight that there are clear opportunities in markets and it is very exciting. There are no other companies like SpaceX and even its closest rival Blue Origin, which is owned by Jeff Bezos, is light years behind (sorry!). But we have to look at the downside risks as properly valuing these is the key for strong long term returns. We see the overlooking of clear governance issues and the huge sums coming into the markets as question marks over market stability and wider equity valuations this year. IPOs can also have wild trading on the day and in the weeks following the IPO before settling at a much lower and appropriate share price.
Looking at the public markets though, you would still be forgiven for thinking there is no disruption to commodity supplies. US equity markets have shrugged off their April decline and are at or near their all-time highs. As we said the capital for the SpaceX IPO has to come from somewhere and it could come from other big tech companies to diversify sector allocations in portfolios. This would put downwards pressure on prices. If investors are feeling good it may come from government bonds, which tend to be out of favour at the moment. It likely won’t come from savings – as we saw, the saving rate from consumers is historically low.
There has been divergence in which parts of the US stock market have done well, and if we zoom out over a long time horizon we can see just what has driven the market and by how much.
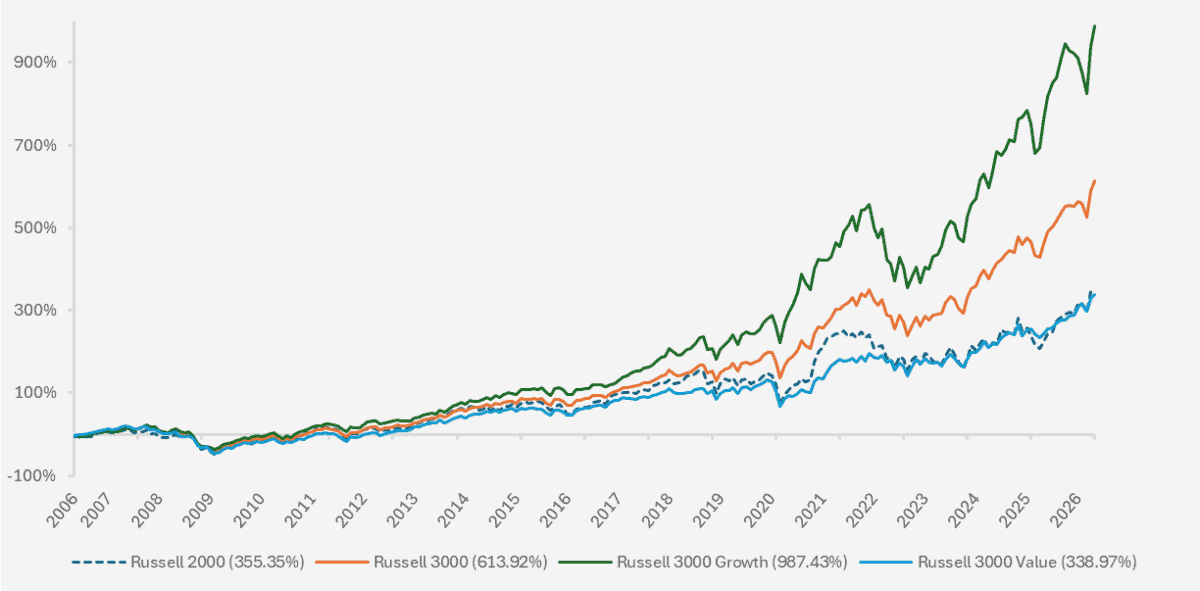
Chart showing the 20-year performance of the Russell 2000 (smaller companies index), the Russell 3000 index (index representing 98% of the investable US equity market) and two Russell 3000 style indices. (Source – Watson French with data from FE Analytics. Data based on monthly returns and in US Dollars. Data correct as at 22.05.2026. Data period runs from 30.04.2006 to 22.05.2026).
If we look at the GFC in 2008 the drop is barely recognisable on the chart. In the low interest rate environment, growth stocks which were asset light were able to flourish and power the index higher. Value stocks have lagged significantly and will likely continue to do so. We reiterate that companies other than the big technology companies building the infrastructure will benefit more than the technology companies themselves because of the huge capital expenditures these companies are spending (examples of this are the building of the railway system, the internet and fibre optic cables). Does this mean value stocks will outperform strongly in the future? Will income regain its position as the generator of long term returns, or is growth investing the new dominant force? It is impossible to say, but remaining diversified will reduce the risk of capturing all of the downside if markets turn. The drivers of the returns in growth stocks have also been very concentrated to just a handful of stocks, and so the chart above hides how much dispersion in underlying stock performance there is.
The chart below plots the calendar year returns of the growth and value indices. Out of the last twenty years, the value index outperformed just five times.
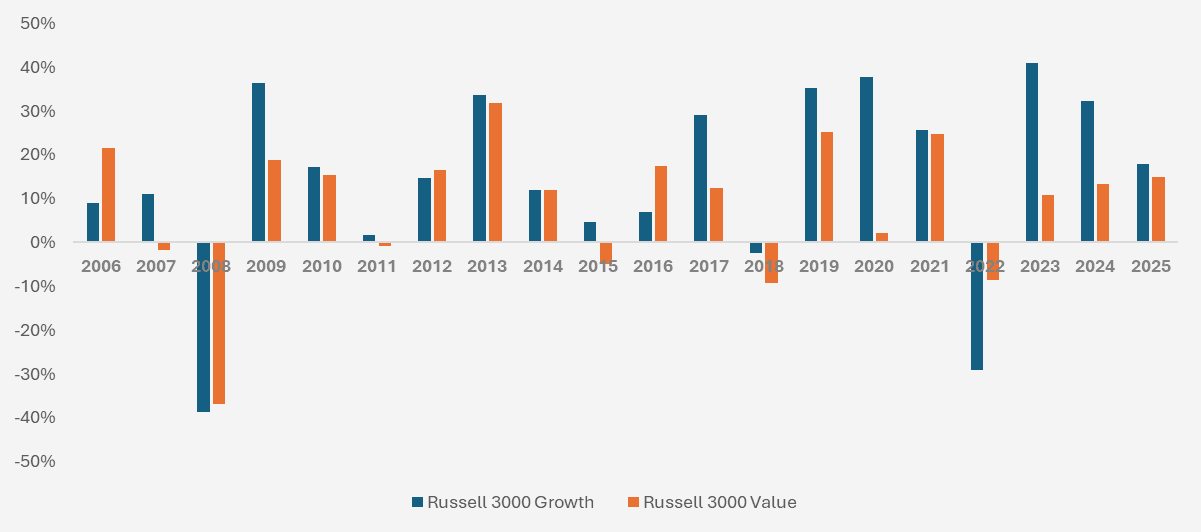
Chart showing the discrete calendar year performance of the Russell 3000 Growth and Value indices over a twenty-year period. (Source – Watson French with data from FE Analytics. Data based on annual calendar year returns in US Dollars. Data correct as of 22.05.2026).
Growth stocks may have a lot of momentum behind them but not investing in them would have cost you a lot. In the US, dividend yields are extremely low at 1.06% (for comparison, the FTSE 100 dividend yield is 3.02%). Interestingly one measure of the attractiveness of the S&P 500, the equity risk premium (the difference between the S&P 500 earnings yield and 10 year treasury note yield) is at its lowest levels in over twenty years, hovering just above zero.
This means that by holding the S&P 500, your expected return would be only marginally higher than the return you could expect from a ten year US government bond. I think there are a few conclusions that we can draw and this makes sense in our view. As bond yields normalise at higher levels, they become more attractive and offer much better returns than they have in the past decade. And while the expected return on the S&P 500 may be low, we reiterate that the S&P 500 is becoming increasingly concentrated (as the big tech stocks which make up the majority of the index have contributed the most to returns over the past few years, we cannot expect these returns to continue at the same pace and so the overall growth of the index should slow, leading to smaller returns). Therefore in our view, an active approach to identify other attractive companies is preferred.
–
UK
UK Gilt yields were rattled this month as the Labour party lost a huge number of local council seats to the Reform party, with the Liberal Democrats also picking up seats. Markets are more focused on whether Keir Starmer will remain as Prime Minister because with him and Rachel Reeves at the helm, the UK’s fiscal constraint is seen as under control. A new leader will likely not follow the same approach, as pressure to deliver ramps up. We expect the political instability and uncertainty to keep yields volatile.
While most global government bond yields have been volatile since inflation picked up in 2022, UK Gilts have been particularly volatile relative to developed market peers. In the past, political risk has driven volatility higher over the short term but later receded as the market moved on. When the Conservatives changed Prime Minister in 2016 (Cameron to May) and 2019 (May to Johnson) Gilt yields were not sensitive to the change, but they are now.
The chart below paints a picture of the behaviour of long term government bonds. Markets are viewing them as too high as inflation has fallen, but since 2008 we have been stuck in a period of low bond yields and we see higher yields as a normalisation, and so expect them to remain higher. Markets have not fully come to terms with this and this is one cause of the volatility that we see.
We think that the extreme event and the massive ramifications caused by the Global Financial Crisis are still being felt today. Not only that, but key structural changes such as an ageing population (less tax receipts received so more borrowing needed) and increased conflict and deglobalisation (more defence spending – see the US decision to remove troops from Germany as an example) are going to mean governments have got to grow the economy faster and possibly accept inflation (growth via improved productivity – and I say possible because we do not know how AI interacts with this) or borrow more.
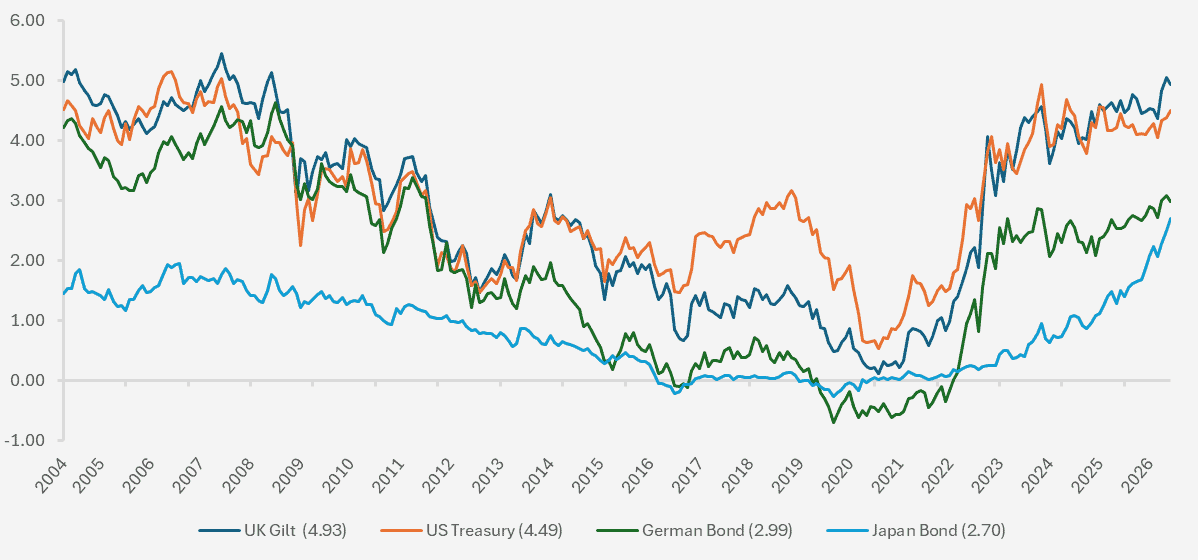
Chart showing the yield on ten-year government bonds over a long time horizon. (Source – Watson French with data from Investing.com. Data based on monthly opening yields. Y-axis shows the absolute yield on the government bonds. Data periods run from 01.04.2004 to 22.05.2026. Data correct as at 22.05.2026). Yields rise as the prices of government bonds fall.
Back to the UK, we think there are several factors at play driving Gilt volatility. The first is clearly the political instability, leading to the risk of breaking fiscal rules and issuing more and more debt. As the debt burden builds more and more tax receipts are spent on repaying this debt and servicing the interest. In some cases this can cause fiscal dominance. This is where central banks lower interest rates to help with the debt burden, which is not part of their mandate and is inflationary.
The second factor is who is buying UK government debt. Defined benefit pension schemes were large buyers of longer term UK debt in the past, but as DB schemes wind down and are bought out by insurance companies, the demand for the long term debt is waning. This will push the yield up on existing long term debt. The government is already looking to issuer shorter term debt instead, the downside of which increases rollover risk – that is, what rate the government refinances at becomes more uncertain.
Domestic investors are accounting for a smaller proportion of new Gilt issuance, with an April 10-year debt issue order book being 25% from overseas investors (relative to 10% back in 2022). The Bank of England, unlike many other developed central banks, is actively selling bonds from its balance sheet through quantitative tightening, rather than letting them naturally mature. This is pushing supply into the market and could be adding 0.15% – 0.25% to the yield on ten year debt. With the UK’s longer maturity dates, the bank needs to sell bonds otherwise they will be waiting decades for a smaller balance sheet. Arguably the most important parties in Gilt trading are hedge funds, with some data showing they account for 60% of daily UK Gilt trading volumes.
In steady markets the hedge funds provide important liquidity, ensuring smooth buying and selling and efficient pricing. If markets were in distress, we could easily see them pull out of the market and liquidity dry up, amplifying moves in bond yields.
The change away from Bank of England quantitative easing (where they are buying gilts) and the fall in DB pension scheme demand shifts what market participants are wanting from Gilts away from price insensitive, UK based and longer time horizon investors, and into highly leveraged, price sensitive and short term hedge funds.
So the question is what this means for Gilts in portfolios. Provided the next (potential) Labour Prime Minister sticks to the fiscal rules, we should see the political premium settle in the medium term (likely picking up at the next general election). Yields will likely remain higher because of higher inflation expectations over the medium term and this means Gilts will offer good value. The income they produce will be attractive and income is less volatile than other forms of returns. Gilts are still expected to offer protection in market crashes, but this is entirely dependent on what causes the crash and how inflation reacts.
For investors in Gilts the short end and the long end are determined by different market forces. The short end is sensitive to where interest rates are going, and the long end is more sensitive to fiscal credibility. So if the war in Iran settles and energy prices fall we could well see the yield curve steepen, with short term rates falling more than long term rates. At a structural level we expect long term yields to remain elevated.
Economic growth was positive for the first quarter of 2025, growing by 0.6% and growing 0.3% in March. Services growth remained strong, driving the economy, with production and construction also adding positively. This growth could be businesses bringing forward activity as they expect the war in Iran to continue and in typical British optimistic fashion, one commentator stated that the first quarter is probably the high point for the economy this year.
Inflation again came in below expectations in April, falling to 2.8% from 3.3% in March and below the 3% figure markets had forecast. The reduction (somewhat ironically) was from the reduction in the energy bill cap. Services inflation also fell from 4.5% to 3.2%. Is this a sign of price pressures easing, or a sign of falling demand?
While this is good news, markets still believe that inflation will rise later in the year and this puts the Bank of England in a particularly difficult spot. Do they increase interest rates or not? Markets are still pricing in two quarter point increases.
UK equities remained in negative territory for most of the month but pushed upwards towards the back end as headlines suggested there may be an end in sight to the war in Iran. The FTSE 100, 250 and UK Small Cap indices are positive this year with returns of 7.04%, 4.61% and 4.87% respectively, but looking at the returns over a longer time period shows how much the FTSE 100 has outperformed the other UK indices.
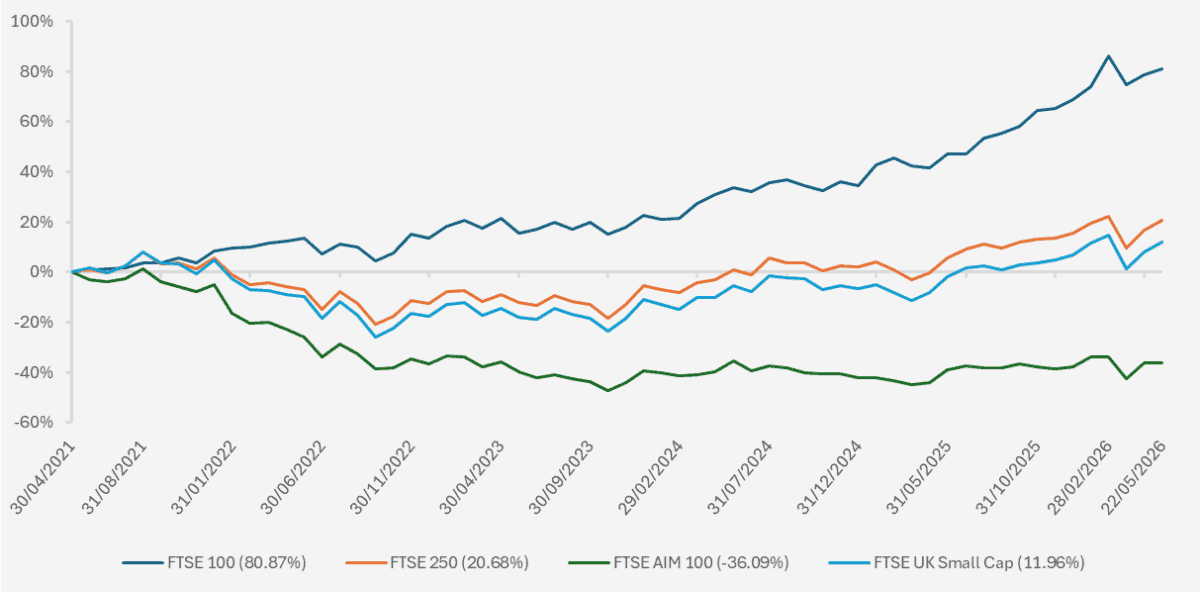
Chart showing the five-year performance of the major UK equity indices. (Source – Watson French with data from FE Analytics. Data based on monthly returns and returns are in pounds sterling. Data correct as at 22.05.2026. Performance period returns from 30.04.2021 to 22.05.2026).
The FTSE AIM 100 index is in a league of its own in terms of underperformance and part of this stems from tax rule changes, as these shares had been used for IHT planning purposes. Other than this the index contains fledgling companies which have just not been able to flourish. The FTSE 100, which contains large companies, has outperformed smaller and medium sized companies by a huge margin. For the past five years UK small cap managers have been saying “now is the time” to invest in smaller companies, but having done so would have left you short-changed. So with such a wide gap, is now the time for smaller companies?
After all, historic data in the US shows that one of the factors that has driven outperformance over time has been the small cap factor. We are sceptical whether this is the case here. Smaller companies have performed well this year in the US even though many of them are unprofitable and this stems from the growth lens through which investors, both retail and professional, look at the US. There are also a lot more smaller companies in the US which are technology focused and the general optimism the US consumer has is a lot more upbeat than in the UK.
It is harder for small companies to flourish in the UK due to tighter labour laws, taxation and more difficult trading conditions. Couple this with more volatile Gilt yields and higher interest rates and we still see a difficult backdrop for small UK companies over the medium term. Depressed valuations for smaller companies and a lack of domestic investors holding UK equities means they will continue to be subject to takeover bids by overseas investors.
–
Emerging Markets
Emerging markets are such a broad category of regions, and with that comes a broad range of demographics, stages of the economy, import/export volumes, commodities exposures and types of companies in the stock market.
It takes all types of companies and countries to make the world work, but as with all assets, from time to time some will outperform and some underperform, and that is what we have seen this year.
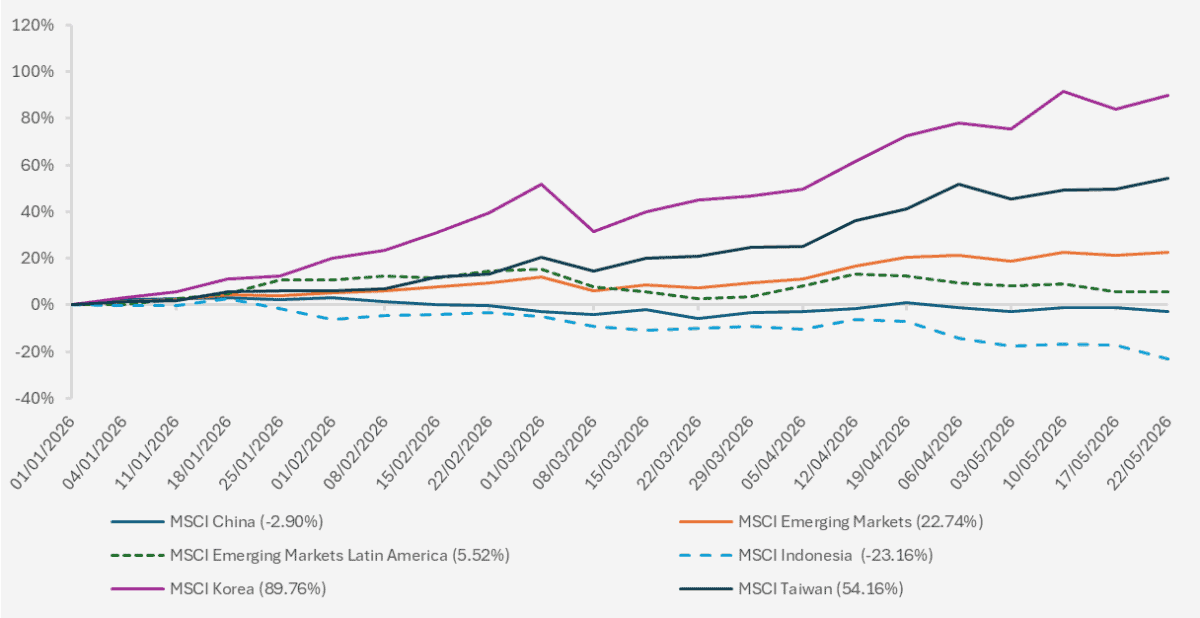
Chart showing the Year to Date returns of various MSCI indices. (Source – Watson French with data from Investing.com. Returns based on weekly returns and hedged back to pounds sterling. Data correct as of 22.05.2026. Data period runs from 01.01.2026 to 22.05.2026).
Taiwan and South Korea have performed so strongly this year because of the makeup of the companies in their stock market. They are dominated by hardware companies creating components for the AI build out, and so even though they are reliant on energy from the Middle East they have been able to fight this off and chip component exports have shored up the economy. The majority of South Korea’s gains come from memory components that are in hot supply. History has shown this is a very cyclical sector and so we shouldn’t expect these gains to continue forever. Taiwan is reliant on TSMC which is a semiconductor foundry, putting the AI chips together. They have a huge grip on the industry but their much-depleted rival Intel is starting to remake itself and could over the longer term put pressure on TSMC.
The demand for the components that these companies make shows no sign of waning which is good for current earnings. The problem comes from capital expenditures needed to meet demand – increasing supply isn’t as simple as turning a switch on. They have to spend billions of dollars of capital in building the facilities to do this. The big risk is that they build this infrastructure and demand falls.
On the other hand, we have countries such as Indonesia which are performing poorly this year. Indonesia has little to no AI exposure in the index and is heaviest in financials (51%) followed far behind by materials (14.2%). Exacerbating Indonesia’s woes is the decision by index provider MSCI to remove several Indonesian companies from the index over transparency issues. Investors are worried about further removals, which has weighed on the index and caused further selling.
But on the economic front south-east Asian countries are reliant on oil imports and do not have the exports to offset these increased costs. Growth was not very strong before the war started and so the war is further straining the countries’ ability to grow. Other countries such as Thailand and Vietnam have had to try and ration fuel demand by encouraging working from home.
The consumer is becoming restless with protests over energy prices and the high cost of living. The central banks in these regions have already started to raise interest rates. In Indonesia interest rates rose by 0.50% to 5.25% having not increased in over two years. However, in Indonesia inflation had been falling this year and sits around 2.4% on a year-on-year basis. The problem is that the currency is weakening, making it more expensive to import goods at a time when energy prices are rising. The cost of exports also rises in this situation and so interest rate increases are an attempt to stop the currency from falling. The flipside of this is higher finance costs for consumers and businesses.
The more support packages governments use the worse the fiscal situation will be, and the worse their currency and their balance of payments will be as well. Government bonds have also sold off pushing yields higher. It’s a tough situation and without an end to the war in Iran we do not see much respite.
In order to have true diversification from the US AI trade you need to go broader than an emerging markets index and look at other regions, such as Latin America and frontier markets. Unlike in developed markets, emerging market equities are heavily influenced by political and economic issues and over the long term these tend to dominate (look at Indonesia as the most recent example). Hedging currency exposures (which can otherwise quickly erode returns) is more expensive and all in all, this has made emerging markets fairly poor in risk adjusted terms. We didn’t see emerging markets as a diversifier to the AI trade in the first place but it does have an allocation in its own right. Emerging markets are not as efficient as developed markets and so we feel active exposure is key here.
–
Robert Dougherty, Investment Director
June 2026
This article is not a recommendation to invest and should not be construed as advice. The value of an investment can go down as well as up, and you may get less back than you invested. Data is correct at time of writing and cannot be guaranteed.