1st March 2026
The majority have been short-term focused – in terms of longer term structural announcements there have been fewer. We cover short-term events as these can change into structural events over time, and they drive investor sentiment and the direction of markets over the short-term, but what we really care about is the structural changes.
What do we mean by this? Short term headlines are ones such as new AI applications (as we describe below), whereas structural changes are ones such as a new Federal Reserve Chairman who wants to shrink the Federal Reserve’s balance sheet, and the rise in private credit lending. We are long term investors and this is a core part of our philosophy. Therefore we take the opportunity in these commentaries to talk about the long term structural themes where we can as these will reflect in how we manage portfolios.
We characterise February as the month of overreaction and big selloffs. It started with AI start-up Anthropic releasing their latest AI model which will help with legal work and other software-type tasks. This caused legal, Software-as-a-Service stocks and accounting stocks to sell-off hard. Following this, a US karaoke company with a market cap of less than $5 million (at the time) released a report detailing how AI can improve logistics and shipping, which caused transport and logistic stocks to sell-off.
A US fintech company called Altruist launched a tool to help financial advisers personalise clients’ investment and tax planning. Asset management and wealth management stocks sold off hard. The latest and perhaps most absurd headline of them all, Citrini, a US thematic equity research company, posted a blog looking at the future (by future they mean 2028 – only two years away, so not far off) and hypothesising what the world would look like should we exit a financial crisis and a recession, and AI takes over jobs but does not replace them.
We are in a world where a one-off blog post causes banks and the wider markets to sell off over a hypothesised and unlikely scenario. Rather than a structurally defining piece of investment research, it sounds more like a poor attempt at the next Terminator movie – robots have taken over jobs such as data entry, and Arnold Schwarzenegger is what, the new Federal Reserve Chairman fighting to keep unemployment low as the robots take over our jobs? Who knows and frankly, who cares.
Markets love a narrative and a reason to do something, and we see this as an excuse for stocks with some expensive valuations to be sold. Again, we reiterate that it is important not to trade headlines but to evaluate what the long-term structural drivers for investment returns are. There is no doubt there will be losers and winners using AI as a new technology, but at the moment we are seeing indiscriminate selling.
We think the latest headlines are not affecting stocks’ cashflows in the future, but perhaps the rate of growth of these cashflows. If we consider the industry lifecycle, sectors start off as immature and fast growing and eventually transition into mature and stable industries – perhaps this is just a shift in this timeline for Software-as-a-Service stocks.
Markets tend to have a one-track mind and are very vulnerable to recency bias – that is, they focus on whatever dominates headlines and often forget about other important factors driving markets. Take UK CPI inflation for example. It peaked at 11.1% in October 2022 and has now fallen to 3.0% as of January. Markets have priced in rates cuts for the rest of the year despite inflation sitting meaningfully above target.
So what if inflation doesn’t fall and instead, picks back up? This is what we have seen in Australia, with the Australian Central Bank increasing interest rates by 0.25% to 3.85%, despite only cutting rates six months ago. The rationale behind this was that the rate of inflation had risen from 3.4% to 3.8% in December. The question on investor’s minds – is this uptick a blip or a sustained increase?
Previously markets had anticipated three more interest rate cuts in Australia this year. If inflation starts picking back up or remains sticky in the UK we could see rates stay at their current level and in the worst scenario go up, not down, pushing bond yields up and causing more pain for consumers and small businesses.
Gold and silver had a quick sell-off at the start of the month with Gold dropping by 13% and Silver by 32%. This was driven by a variety of selling pressures, including China announcing a crackdown on speculative trading, the net asset value of a Silver ETF rising to a 50% premium and trading being halted, the announcement of Kevin Warsh as the new Federal Reserve Chairman and a large volume of options contracts expiring at the end of the month. Many investors believe Gold is a long term macro play rather than a hedge and believe the yellow metal has further to run. Smaller metals such as Silver are getting carried away in their view though. Last time Gold had such a stellar rise, the Federal Reserve increasing interest rates brought the price back down. With this looking unlikely, Gold will trade based on whatever headlines support it on the day.
We still see precious metals as emotional assets with no intrinsic value (i.e. the value is based on what someone else will pay, not what the underlying cashflows are worth, as there are none). As we saw with these large drops recently, the market can quickly turn.
–
Areas of focus
- Consumer staples and more asset-heavy stocks in the US have outperformed this year relative to technology stocks, but we see a wide divergence in sub-sectors within technology.
- Oil prices have risen as tensions in the Middle East again build up.
- UK equities continue the year strongly with banking, defence and mining companies leading the way.
- Emerging market equities continue to be attractive for investors. They are supported by a weaker US Dollar and diversification away from big US tech (which is questionable).
- Corporate and high yield bond spreads have inched up slightly, likely driven by AI and software related credit selling off and a spillover from the concerns over private credit.
- Crypto currencies and digital assets continue to face selling pressure, highlighting the speculative and volatile nature of the assets.
- Small and unprofitable companies in the US continue to post positive returns as the junk rally continues.
–
Asset Class Returns
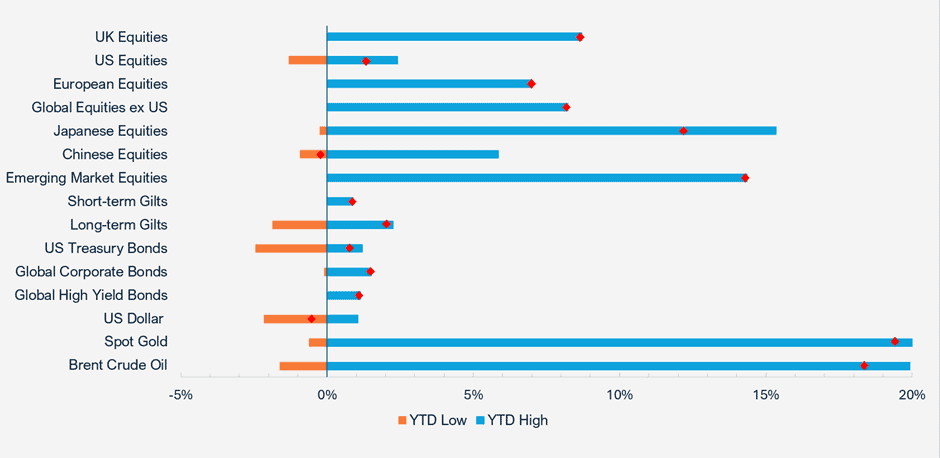
Selection of asset 2026 YTD returns and their range of returns as at 26.02.2026 (the two ends of the bars represent the range of YTD returns and the red dots represent the current YTD return. Indices used: FTSE All-Share, Russell 3000, STOXX Europe 600, MSCI World ex USA, MSCI Japan, MSCI China, MSCI Emerging Markets, FTSE UK Conventional Up To 5 Years, FTSE UK Conventional Over 15 Years, ICE BOFA US Treasury, ICE BOFA Global Corporate Hedged GBP, ICE BOFA Global High Yield Hedged GBP, US Dollar Index, S&P GSCI Gold Spot & S&P GSCI Brent Crude Spot. Returns hedged back to GBP with exception of US Dollar which is in US Dollar terms. Returns based on daily returns. Source – Watson French with data from FE Analytics and MarketWatch. Data correct as at 26.02.2026).
–
US
Kevin Warsh defeated the other Kevin, Kevin Hassett, in securing President Trump’s nomination to be the next Federal Reserve Chairman, replacing Jerome Powell who is due to step down in May.
Warsh has been very critical of the Fed in recent years and believes that the Fed is too data dependent which leads them to miss things and react too slowly. He thinks the Fed should be forward-focused and should lower rates as the AI productivity ‘boom’ will be deflationary. He also wants to significantly shrink the Federal Reserve’s balance sheet, which stands at $6.5 trillion. A smaller balance sheet will mean that there is less liquidity in the market.
The effect of this would be significant and would not please Trump, who wants low rates. To shrink its balance sheet the Fed will need to sell the bond and ABS (asset backed securities) holdings it owns, or let them mature without replacing them. Lower demand while supply is constant or increasing means lower prices and thus higher yields. The Fed can control short-term rates through its setting of the Fed Funds rate, but the longer end of the yield curve is controlled by the market supply and demand dynamics. US mortgages are priced off of the long end and so higher yields equals higher mortgage rates.
Combine this with a possible future privatisation of Fannie Mae and Freddie Mac, which play an important role in enabling liquidity and stability in the mortgage market, and we could see even higher rates leading to destabilisation in the property market, which is already fragile at best.
Money markets (where governments, banks and corporates borrow and lend money) are complex and rates and liquidity are determined by the level of reserves that the Fed has on its balance sheet. Shrinking the balance sheet will put strain on the money markets and could cause a liquidity crisis.
Warsh can talk the talk while he isn’t Chair but markets will be watching if he actually puts this into action, which is an entirely different thing.
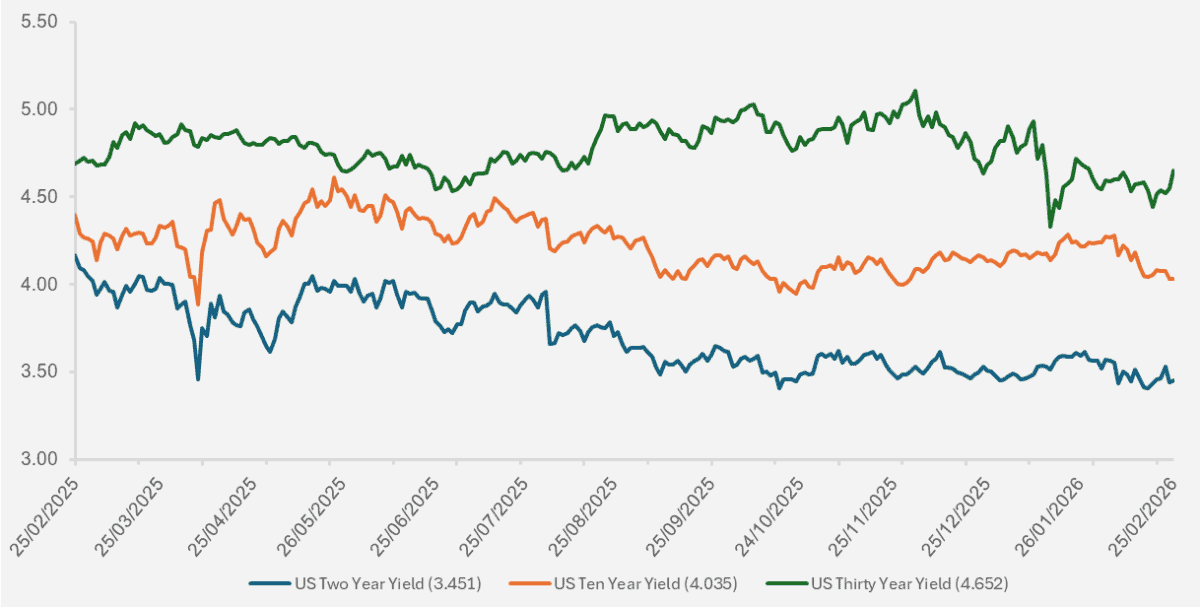
Chart showing the running yields on two, ten and thirty year US Treasury Bonds over the past year. (Source – Watson French with data from investing.com. Data based on daily opening yields. Data period from 25.02.2025 – 25.02.2026. Data correct as at 25.02.2026). When the lines fall this means the yield is falling and the price of the bond is rising. With CPI for January at 2.4%, real yields are positive for the US investor.
We had multiple ‘DeepSeek style’ moments this month, with software stocks selling off hard as AI company Anthropic released a new AI model which markets deemed would make software companies less valuable. We look at a few specific anecdotes below to see why there is risk in the market, with strange behaviours leading to strange valuations.
Technology company Alphabet is planning to issue a 100-year sterling bond alongside a range of other short maturity dollar bonds to fund its AI capital expenditure. A century bond is unusual and isn’t something we see often. We think this is possibly a sign that Alphabet are becoming nervous that they will need to continuously come back to the bond market to raise more capital and demand may start to wane. Not only this but they will have to pay back this debt.
Big technology companies in their recent quarterly earnings reports have announced increased capital expenditure and this time they have been punished with falling share prices, as markets question whether the return on this investment will be sufficient to make the spending worthwhile. Amazon released strong earnings but as it announced plans to spend $200 billion, more than the $125 billion it spent last year, its shares fell 9%. Microsoft shares fell 5% after announcing high capital expenditure, despite generating good earnings growth.
We see this as a good thing, taking some of the froth out of the market with investors asking rational questions. Interestingly Apple, which has the lowest planned spending out of any of the big tech companies, has actually seen its share price rise lately. Apple has decided to utilise Google’s Gemini AI in its product offering rather than continuing to develop its own model and so it has much lower spending needs. This makes its success less dependent on which AI company is ultimately the winner and doesn’t leave it holding potentially expensive and useless data centres should the AI trade go belly up. It is retaining the asset light business model that has been so successful and profitable over the past decade.
We think this is following the narrative that returns will spread out into different areas of the market. For example, while the S&P 500 has had weak returns, the equal weighted version of the index and the Dow Jones Industrial Average index have performed relatively better.
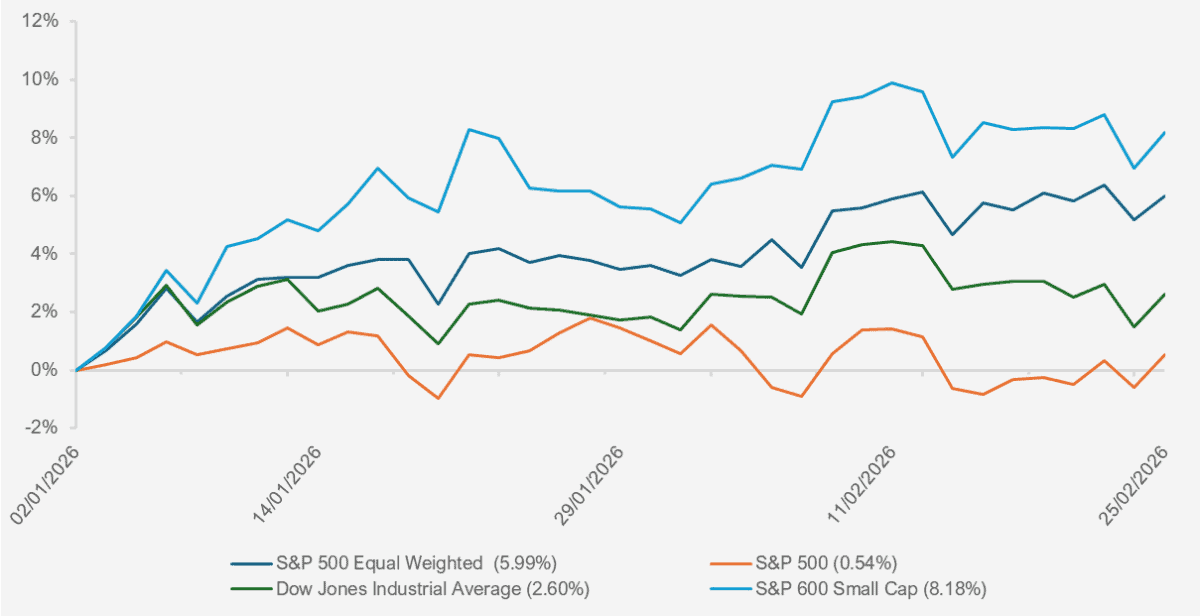
Chart showing the YTD performance of various US equity indices (S&P 500 Equal Weighted, S&P 500 Market Cap Weighted, Dow Jones Industrial Average & S&P 600 Small Cap). (Source – Watson French with data from investing.com. Returns are in US Dollars and based on daily opening prices. Return period between 02.01.2026 – 25.02.2026. Data correct as of 25.02.2026). The Dow Jones Industrial Average is generally an indicator for the broader economy while the S&P 500 Market Weighted index is dominated by big tech.
Memory companies have performed very strongly as demand for memory in AI applications has rocketed. Sandisk, which makes Nand memory which is in hot demand, has seen its share price increase by over 1,500% over the past year. We have seen booms and busts in memory companies before and see this as a warning not to be concentrated in any one stock or sector.
So what does all of this tell us? The markets’ narrative suggests that we will all be building our own software packages, digital media and video games and we won’t need software companies, but we will all need a lot of memory chips (so getting learning your RAM and NAND) – an unlikely outcome in reality.
What does give us some confidence in the Magnificent Seven companies is that since the April 2025 tariff announcements, the earnings outlook has remained strong and positive, while for the rest of the 493 companies in the S&P 500 earnings are expected to be flat and have not changed. Nvidia proved this point recently with earnings and revenues beating expectations.
Another point to take from this lack of earnings growth is that AI integration has clearly not had any effect on large cap companies yet. This will be a long term change as productivity increases take time.
Another reason we believe we will see a wider divergence in performance in US stocks is due to the accounting treatment of capital expenditures such as data centres. We have two main problems here. The first is that some of these purchases are being kept off-balance sheet which makes reading and understanding a company’s financial position and the risks involved difficult. This could lead to unexpected shocks in performance.
The second problem is how the depreciation of capital expenditure is recorded on income statements. When a company purchases a fixed asset such as a data centre, the purchase price is not recorded as an expense on the income statement straight away, rather the cost is divided into its useful life and each year a part of this is included as an expense on the income statement as depreciation.
There are rules in the US which will come into force in 2028 to clarify how this is shown but presently there is no set way that big technology companies show this. This is important because depreciation is an expense which lowers a company’s profit. Historically the big tech companies have been asset-light businesses with high profit margins and depreciation has not been a big expense. With the volume of data centres increasing and the Nvidia chip racks in them having a relatively short useful life, depreciation will be a big issue.
This matters for a few reasons. Firstly, it will lower the companies’ historically high profit margins and earnings, deteriorating some of their most attractive features. Secondly, it could mean lower earnings growth. As we mentioned, the majority of the earnings growth in the S&P 500 has come from the big tech companies.
Finally, as there is no set way to show this it becomes difficult to value a company, as financial statements become more opaque. This will lead to a wider range of valuations and likely bigger moves in share prices on announcements.
We can see how big tech companies are manipulating this already. Meta recently extended the useful life of its servers and networking equipment from four years to five and half years. This means it will save $2.9 billion in 2025 as the depreciation schedule changes.
Furthermore a Wall Street Journal article pointed out that Meta’s price to free cashflow ratio (a type of valuation metric) for 2025 was 38 times, pretty expensive. If you include costs such as stock based compensation the ratio rockets to over 1,000 times, which is absolutely ludicrous.
When companies start getting creative with accounting it can indicate bumpy and desperate times.
Recent labour market data showed that the US economy added 130,000 jobs in January, far above the 55,000 jobs markets had expected. The unemployment rate also ticked down from 4.4% to 4.3%. Inflation came in at 2.4% but some analysts think this is worse than the headline figure suggests.
On the face of it this is good economic data and will likely mean the Federal Reserve will keep rates on hold at their next meeting. When we look a bit deeper though there are some areas of concern.
First of all we have tended to see some big revisions to the number of jobs created on a monthly basis, with only two upward revisions in the last two years. In 2024, 2 million jobs were estimated to have been created, but this was later revised down to 1.5 million. In 2025, 584,000 jobs were estimated to have been created, which were subsequently revised down to just 181,000.
Of the jobs created in January, 82,000 came from the healthcare and social assistance sector which has grown by 12.5% in the past three years compared to less than 2% for all other sectors. With the government looking to cut back spending on healthcare this could quickly cause an uptick in healthcare job layoffs and damage the precipitously balanced labour market. We could however see the economy keep on growing even if labour declines, because a lot of the growth may be being powered by AI infrastructure spending.
Trump’s tariffs under IEEPA were declared illegal by the US Supreme Court but this hasn’t really helped markets. Trump later declared a 15% global tariff under a different set of legislative provisions which can last for up to 150 days and this has punished some countries like the UK, which had capitulated to a 10% tariff rate, and helped countries like China which have effectively ended up with a lower tariff rate.
Markets were mostly unmoved on this news but we expect US bond yields to rise over time, as it will leave a bigger fiscal hole to fill at a time of tax cuts. What fills this hole? You guessed it – US government bonds.
We are keeping an eye on any developments in Iran and possible escalation in conflict there. It is impossible to say what will happen but it ties in with our long term structural theme of rearmament and increased conflict. We will keep seeing this over the long term (as I edit this article Pakistan have declared open war with Afghanistan) and therefore a diversified portfolio with a healthy allocation to government bonds and shorter duration equities such as value stocks (which the UK is full of) is important, not just the high flying growth stocks. This is because in times of market distress and shock investors like the safety of government bonds, and equities with more established cashflows which have a history of paying dividends tend to do better.
Finally we are very cognisant of private credit and in particular business development companies (BDCs) in the US. BDCs are investment vehicles which provide loans to smaller and less financially stable businesses and form part of the private credit sector. These businesses tend to be risky and find it difficult to borrow from traditional banks. Interest rates on the loans are floating rate and come with a large premium to a risk-free rate, often in the double digits. The business case for software companies has come under pressure due to recent AI announcements and BDCs have a high exposure to the software sector.
Private credit in general has had a rough patch, with listed private credit companies seeing their share prices plummet. Private credit (and equity) is inherently illiquid because assets are not traded on a stock exchange. Institutions have been trying to push private credit so it can be marketed to retail investors. This narrative took a hit with the large private credit firm Blue Owl having to sell down one of its funds over time and take out loans to return capital to investors to meet redemption requests, highlighting its unsuitability for retail investors who have varying time horizons.
We see private credit as a fundamental risk over the medium to long term. Any crises in private credit will have ramifications for the wider market and asset classes.
–
UK
We wrote last month about the ever-shrinking UK stock market, with M&A and buybacks shallowing out the market. Unfortunately we started February with another privatisation as the global asset manager Schroders agreed to be taken over by US investment manager Nuveen (which is owned by the Teachers Insurance and Annuity Association of America) for £9.9 billion. Prior to this news Schroders’ share price had fallen around 25% over the past five years. The corporate raiding of cheap UK companies continues.
The FCA is attempting to prove to global investors that the UK market is more liquid than what is reported by publishing all trading data for London listed shares in a bid to attract more capital to the markets. While the market is certainly more liquid than what we see, due to opaque trading mechanisms such as dark pools, over the counter trades and systematic internalisers (big investment firms who do not use an exchange to trade shares), we think this will only make a difference at the margins.
We are continuing to see a preference for overseas capital allocation with Vanguard being the latest manager to reduce their UK home bias within their flagship LifeStrategy range. Again, we reiterate the short term bias towards recent stock market performance as a driver of this change – similar to how big managers and investment banks are recommending holding large amounts of gold in strategic asset allocations and some even saying it should take the place of traditional government bonds as a diversifier. If gold hadn’t shot up in value over the past few years, would they still be recommending this?
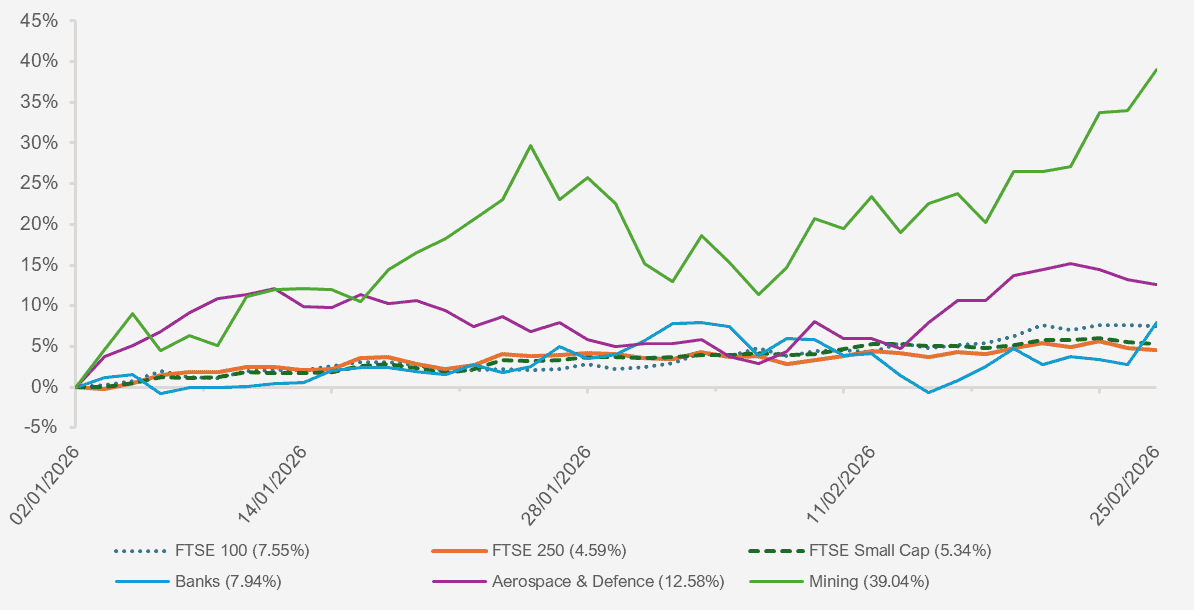
Chart showing the performance of major UK equity indices and select UK equity sectors. Equity sectors are represented by the FTSE All Share index for that sector. (Source – Watson French with data from Investing.com. Returns are in Pounds Sterling. Returns based on daily opening prices. Return period between 02.01.2026 – 25.02.2026. Data correct as of 25.02.2026).
UK economic growth was weak in Q4 2025, growing by just 0.1%. Total growth for 2025 was 1.3%. Weaker economic growth could push the Bank of England to cut rates at their next meeting, as in their recent meeting they opted to hold rates at 3.75%. Under the surface though we see the Monetary Policy Committee (MPC) leaning towards cutting rates as at the last meeting, five members voted to hold rates as they are, and four voted for a cut.
We are seeing more transparency in the Bank’s communications with each voting member of the MPC having 200 words to explain their vote, referencing some of the issues in the bank employees’ quarterly Monetary Policy Report. Based on the report the employees would have cut rates.
Further rate cuts could weaken the pound versus the dollar and provide extra return for sterling investors’ unhedged US equity holdings.
CPI inflation dropped to 3% in January, down from 3.4% in the previous month with broader disinflation (slowing inflation, different from deflation which is negative inflation) across most areas. The core CPI rate which excludes energy and food prices fell from 3.2% to 3.1% and services inflation declined from 4.5% to 4.4%. Services inflation is important for the UK economy as it is services-heavy but remains above the Bank of England’s target. Low economic growth, rising unemployment (which rose to 5.2% for the last quarter of 2025, including youth unemployment at 16.1%) should persuade the remaining MPC members to cut rates at their next meeting in March.
UK borrowing costs are higher than their developed market counterparts and recent speculation around defence spending will put pressure on rates. The UK needs to fund its defence spending but Rachel Reeves is holding the line in sticking to her fiscal rules. There are therefore discussions on whether the defence spending can be kept outside of their rules, which will allow the UK to issue more gilts to fund it. This will almost certainly upset the bond market and push yields higher.
One thing that did please the bond markets this month is that forecasts for UK government bond sales are expected to drop, something we have not seen for four years. Part of this comes from a lower amount needed to refinance maturing debt, and partly from a reduction in borrowing levels because of increased taxes. This will give the government some breathing space but also introduces political risk. With the government and Keir Starmer particularly unpopular according to consumer surveys, any reduction in borrowing will allow bond yields to fall, which could mean the tax rises proposed at the Autumn Budget (which were pushed out into the future) may not materialise. Furthermore, local elections in May could put pressure on the government to be fiscally unresponsible.
–
Europe
Inflation in the Eurozone fell to 1.7% in January, meeting market’s expectations. Core inflation fell from 2.3% to 2.2% and services inflation fell from 3.4% to 3.2%.
Markets expect the European Central Bank (ECB) to keep rates on hold but there are increasing possibilities that a strong Euro will prompt the bank to lower rates to spur demand, increase import inflation and make exports more competitive in order to stop inflation falling too low.
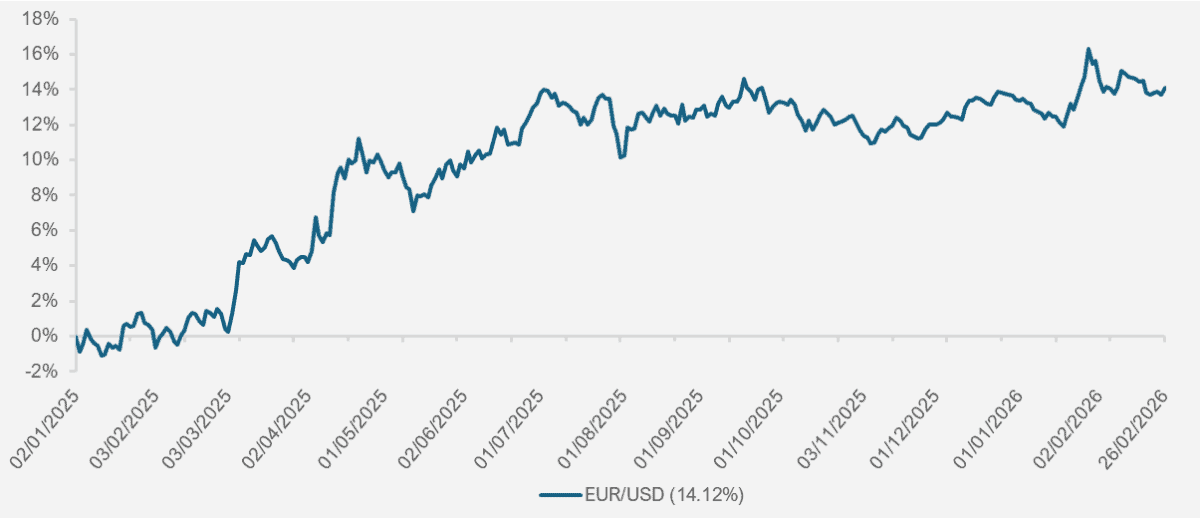
Chart showing the cumulative gain/loss in the EUR/USD exchange rate since the beginning of 2025. When the blue line rises the Euro is strengthening against the USD, that is one Euro will buy you more USD, but one USD will buy you less Euros. (Source – Watson French with data from investing.com. Data based on daily opening exchange rate. Data period from 02.01.2025 – 26.02.2026. Data correct as of 26.02.2026).
Since the start of 2025 the Euro has strengthened against the US Dollar by around 14%. Part of a currency’s attractiveness is the interest rate differential between two countries. With the Euro area interest rate at 2.15% and the Fed funds rate at a range of 3.50% to 3.75%, the US Dollar should be attractive – this weakening in the dollar therefore points to geopolitical issues with the US, an increased volume of investors hedging US Dollar assets and the desire for the US to have a weaker dollar… or is it stronger? This depends on who in the US administration you ask. A stronger Euro makes European equities more attractive for US investors and this could be helping the inflows we describe below.
European equities have been on track for record monthly inflows in February following a strong end to 2025. The important question here – is this because European equities have genuinely attractive qualities, or is this investors just diversifying away from the US. We think there are pockets of attractive companies in Europe but for Europe to really excel on a long term basis the regulatory environment needs to improve.
We are seeing a greater push for this with proposals to make a core group of EU countries. The core group would streamline decision making should the wider 27 member bloc not come to a consensus.
There are technology companies in Europe such as ASML but investors like Europe for older economy sectors, such as banking and industrials. When valuations are high in US technology companies, these steady-growing and income-paying companies become relatively more attractive.
Asia is also a diversifying trade away from US assets but it is more exposed to technology companies and indices are highly concentrated (see below). If we see a slowdown in US technology companies this will spill over into Asia. Combined with a more attractive structural currency, this leads us to view Europe as a better diversifier for the “sell America” trade. Over the long term Emerging Markets carry much more risk and have a negative Sharpe ratio (a risk adjusted measure).
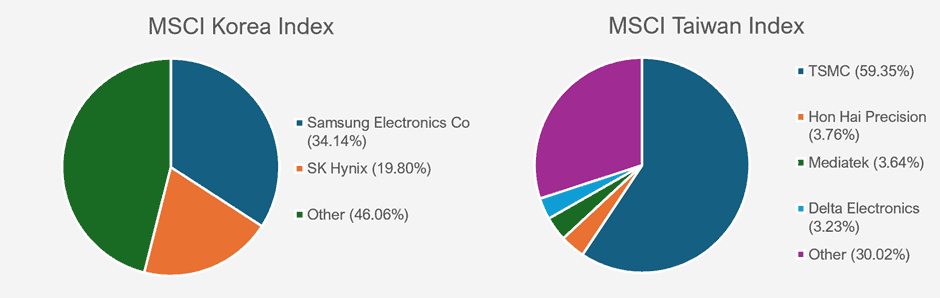
Charts showing major constituents in both the MSCI Korea index and MSCI Taiwan index. (Source – Watson French with data from MSCI. Latest weightings as at 30.01.2026). There are 86 constituents in the MSCI Taiwan index. Note how 82 stocks account for just 30.02% of the index. In the MSCI Korea index there are 81 constituents, of which 79 account for 46.06% of the index. While this is better than the Taiwan index, two stocks still account for over half of the Korea index weightings.
–
Japan
Sanae Takaichi convincingly won the Japanese snap election and shored up the Liberal Democratic Party’s power in government. Stocks pushed higher on the win with markets expecting her looser fiscal stance to result in increased spending and tax cuts.
The question now is will she do what she said she would, or was she simply saying the right things to please the voters? Government bond markets (which are sensitive to fiscal policy decisions) in Japan didn’t push up too much higher on the news, suggesting that they think the Prime Minister will not be as aggressive as originally thought.
Japanese equities are becoming increasingly expensive and rising bond yields should keep their values contained. At the same time, and as we keep mentioning, corporate reforms are making value companies look very attractive. In 2025 we saw quality and growth companies struggle and we don’t see an obvious catalyst for this to change.
Japan is both a macro and a micro trade. The macro trade looks at the demographics of the country (ageing population and rate of increase/decline in population numbers) and the government debt level. From this perspective Japan looks fairly unattractive, certainly in the fixed income markets as these factors point to higher long term borrowing costs.
We also add the tension with China and Chinese companies copying what Japanese companies are doing at a lower cost. At the macro level, value companies are still attractive however. On the micro level we look at the corporate reforms. Value companies are attractive because they are selling off underperforming and irrelevant periphery businesses, and improving their dividend payouts and return on equity ratios. Which style outperforms over a given period changes over time though, as the chart below shows.
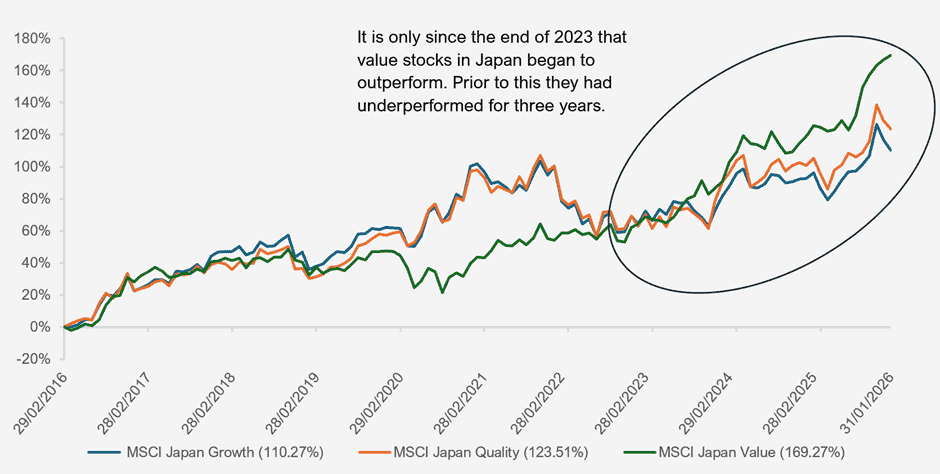
Chart showing the performance of growth, quality and value styles in Japanese equities over a ten year period. (Source – Watson French with data from FE Analytics. Returns are in Pounds Sterling and data based on monthly returns. MSCI Indices are used as proxies for stocks which exhibit characteristics of the three styles. Return period between 29.02.2016 – 31.01.2026. Data correct as of 25.02.2026).
Japanese bond yields will be a big driving force in what we see in US Treasury bond markets as well, as we talked about in last month’s commentary.
–
Robert Dougherty, Investment Director
March 2026
This article is not a recommendation to invest and should not be construed as advice. The value of an investment can go down as well as up, and you may get less back than you invested. Data is correct at time of writing and cannot be guaranteed.