16th December 2025
In our view the market has tread a thin line, and we characterise the performance towards the second half of the year as cautiously optimistic. We have seen several major events dominating the headlines but as always, we view these narratives through longer term structural themes.
These structural themes include the digitisation of the economy and a shift to new technologies; ageing populations; a government preference for increased indebtedness to drive growth; a normalisation of interest rates following years of low rates; a move for rearmament aligning with increased conflict; and a change in the geopolitical systems of the world i.e. deglobalisation.
Within each of these themes we can place the narratives we have seen this year, such as the rise of the retail investor, questions over central bank independence, the drive to increase defence spending as a share of GDP and a shift from longer term government debt to shorter term government debt. We will continue to see these structural themes drive markets throughout the rest of the decade and keeping this in mind helps us to navigate short term shocks, such as the one we saw in early January when DeepSeek announced a new AI model, rocking the big US technology company valuations.
Throughout the year markets exhibited bubble-like characteristics. Even with this at the forefront of investors’ minds, allocations to cash remained low and investors remained in a risk-on mindset.
Financial conditions have looked good throughout the year with stock markets near all-time highs and corporate bond spreads tight. When markets are trading at high valuations it pays to be aware of fundamental behavioural biases that dictate our behaviour and market movements. This is important for risk management but also to understand the narratives we detailed above. For example, the normalisation of interest rates has produced big moves in government bond markets and has led to some market participants questioning the use of government bonds in portfolios.
However, it could be argued these investors are suffering from “recency bias”, both in terms of how these assets have performed over the short term and interest rate levels over the medium term relative to other periods in history. Not acknowledging this bias can lead to sub-optimal asset allocation decisions. Another example is the “fear of missing out” or herd behaviour – this has led to investors, both retail and professional, utilising high levels of leverage to maximise their returns. In a roundabout way, the key takeaway here is that timing the market is extremely difficult and usually unwise.
Increasing leverage has put strain on the money markets and led to Federal Reserve intervention to prevent a build-up of stress. This remains a concern and investors will be closely watching this into next year.
Passive investing remained popular throughout the year but with markets in their current state, we see more opportunity for active management – not just to provide better returns, but also to adapt better should we see a correction or stagnation in markets. High levels of passive investing contributes to the volatility we have seen in markets and adds to the concentration of risk.
Lots of financial data points to a slowdown in returns over the next year but presently we have seen no obvious catalyst to jump start this. We go into more detail on performance in the US and the UK later in the article.
–
Areas of note
- The FTSE 100 reached an all-time high this year despite lacking in technology companies. Performance was driven by defence companies and banks.
- US equities posted positive returns but struggled (relatively) in non-US Dollar terms due to the weakening of the dollar. Big tech and speculative stocks drove the rally leading to a more concentrated market.
- Global emerging markets performed strongly this year, driven by a weaker US Dollar and economies further along in their rate cutting cycle. We also saw country-specific performance, for example, from South Korea due to their technology-heavy indices.
- Gold and silver performed strongly, initially driven by geopolitical fears and fiscal concerns but later turning into a momentum trade.
- Cryptocurrencies proved to be volatile again with huge deviations in value. The pro-crypto Trump administration focused more on stablecoin adoption, limiting their potential performance.
- Oil prices fell while US treasury yields on the longer end rose. They tend to move in tandem and their deviation points to fiscal concerns in the US.
- Global government yield curves steepened as short term rates fell and long term rates rose.
- Investment grade and high yield corporate bond spreads remain tight with the risk of spreads widening present all year.
- Chinese equities posted positive returns driven by the technology and AI theme. China is still in a period of deflation with a property slump expected to last at least two more years, but its stance on tariffs helped to cement its place in world trade.
- European equities performed well, driven by defence and financial companies. Investors increased allocations to the region to provide diversification away from US equities. Increased spending in Germany helped to boost stock markets and increase bond yields while political problems in France pushed long term debt yields much higher.
- Japanese equities continued to post positive returns as shareholder reforms continue. Bond yields rose as a new Prime Minister announced supportive spending and fiscal policies and the Bank of Japan could potentially increase interest rates further to control inflation.
–
Asset Class Returns
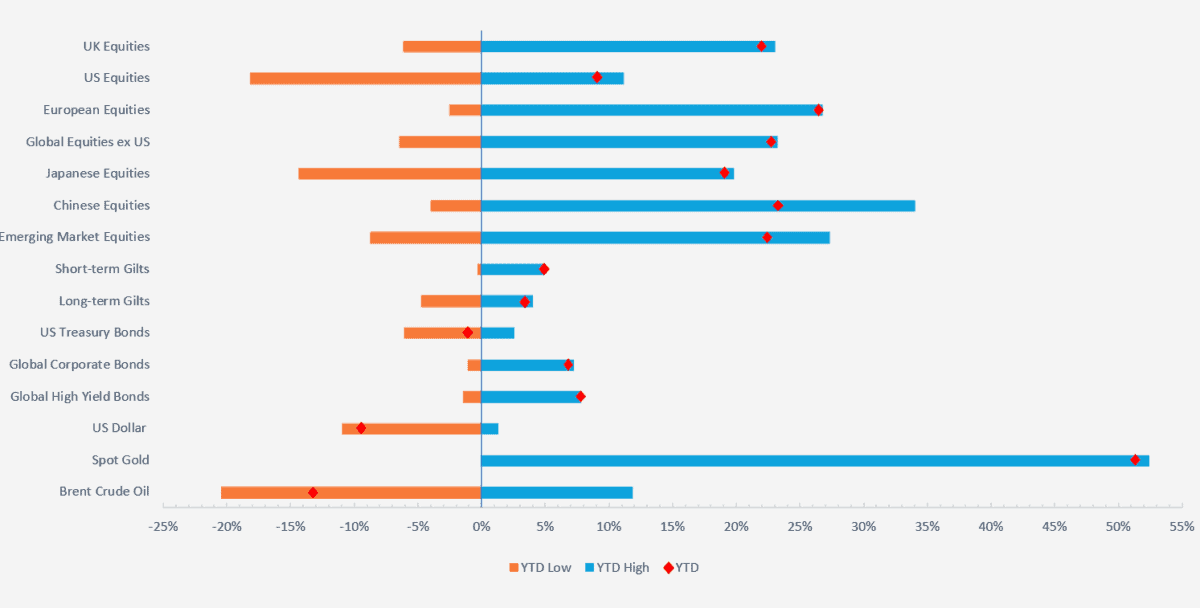
Selection of assets 2025 YTD returns and range of returns as at 15.12.2025 (the two ends of the bars represent the range of YTD returns and the red dots represent the current YTD return). Indexes used: FTSE All-Share, Russell 2000, STOXX Europe 600, MSCI World ex USA, MSCI Japan, MSCI China, MSCI Emerging Markets, FTSE UK Conventional Up To 5 Years, FTSE UK Conventional Over 15 Years, ICE BOFA US Treasury, ICE BOFA Global Corporate Hedged GBP, ICE BOFA Global High Yield Hedge GBP, US Dollar Index, S&P GSCI Gold Spot & S&P GSCI Brent Crude Spot. Returns hedged back to GBP with exception of US Dollar which is in US Dollar terms. Returns based on daily data. Source – Watson French with data from FE Analytics and MarketWatch. Data correct as at 15.11.2025).
–
US

Chart showing YTD performance of various US equity indices and sub-indices (Source – Watson French with data from FE Analytics. Returns hedged back to GBP. Data based on bi-weekly returns. Data correct as at 15.12.2025. Magnificent Seven represented by the Roundhill ETF. Its use is for illustration purposes only and is not a recommendation to invest).
As we approach the end of the year US equity markets have performed strongly but have recently started to lose some steam. Looking at the chart above you would be forgiven for thinking it was a fairly quiet year – we had a pullback in April followed by a strong rally, but this hides many of the other headlines we saw. Overall markets provided double digit returns in US Dollar terms and strong single digit returns in sterling.
US equities lag behind other developed and broad emerging markets in both local currency terms and in sterling, which doesn’t happen often. All the while, the Magnificent Seven US companies posted returns of over 20% in US Dollar terms. The main driver of US performance throughout the year was the artificial intelligence theme, with the biggest US tech companies delivering strong returns as AI technology improved and data centre demand picked up. Revenue and deals started to look more circular, as technology companies agreed to buy from each other and invest in each other, but investors mostly ignored these risks.
Coming to the end of the year though, investors have started to question certain companies’ valuations and future growth prospects. While this could be seen as a concern, we see it as sensible, releasing steam from a highly-valued market.
We saw beneficiaries of the AI buildout benefit, more so than the hyper-scalers themselves. For example, US energy companies and nuclear energy companies saw huge share price returns as the expected energy demand driven by AI picked up.
A high proportion of unprofitable small cap stocks also posted high returns, driven by increased retail investor participation and the use of leverage. Under the surface this looks like herd (and late-cycle) behaviour.
We continued to see some promising earnings growth and valuation increases but also pockets of concern at the margins. As long as it stays at the margin, we don’t see any major nor obvious catalysts for a market correction at the present time.
The chart above highlights that the US market was pulled higher by the big tech stocks, potentially hiding weakness in the rest of the market. This is shown by looking at the performance of the NASDAQ and the Magnificent Seven versus the equal-weighted S&P 500 and the Dow Jones Industrial Average.
The big tech companies have been rushing to build out data centre capacity and have turned to the debt market to finance some of this. This has started to move the risk of failure away from the shareholder and into a more systematic risk. Risk of competition from China, or from a stall in AI adoption or innovation has weighed on valuations recently but the biggest companies such as Microsoft, Alphabet and Amazon already have established businesses with strong cashflows, which shields them better relative to OpenAI which is not yet profitable. As we said at the start of the year, stock selection has remained key throughout 2026.
The main “highlight” of the year was President Trump announcing high tariff rates on the rest of the world in April. These were subsequently scaled back and markets moved higher on this news. Tariffs are still much higher than they were prior to the announcements in April. High equity market valuations showed that investors thought the tariffs would not weigh on economic growth too much and their inflationary impact would be short lived. Markets continued throughout the year in the shadow of potential higher tariff rates and in November we saw the US government go to the Supreme Court over the legitimacy of the tariffs. We await the outcome of this ruling.
Trump also managed to pass his big tax bill in congress and much of this is expected to give a boost to GDP in 2026.
The other dominating theme throughout the year was the Federal Reserve and interest rates. Fed Chairman Jerome Powell faced pressure throughout the year to cut interest rates drastically and this caused some anxiety in markets. Powell’s term as the Fed’s Chair ends in early 2026 and Trump is expected to pick a potentially less independent successor, which could pull short term bond yields down but push longer term bond yields higher.
Interest rates were cut three times in 2025, ending at a rate of 3.5% to 3.75%. Markets are pricing in a neutral rate around this level, which could prove dangerous given inflation is still above the Fed’s 2% target (2.8% in September and up from 2.6% in January).
To add more complexity to the situation, markets lost several months of economic data as the government shut down again.
The Fed has battled with above-target inflation and a potentially weak labour market, and interest rate decisions are finely balanced on which of their two mandates (stable prices and maximum employment) is further from target.
The labour market has been an interesting point. Unemployment has not moved up by much despite the numbers of jobs being created weakening drastically. This is a result of a smaller workforce. Some of this comes from Trump’s policies on immigration and deportation and some from the use of AI replacing workers. What is clear is that a small uptick in jobs being lost will have a bigger impact on the unemployment rate.
Markets are becoming more concerned with the sustainability of US debt as gross debt to GDP has increased to 124.3% (in 2019 it was 106.6%) and is forecast to increase further with Trump’s new tax bill. The US government spends more on the interest payments on its debt than it does on its defence spending. This in addition to concerns over Federal Reserve independence, which has caused a steepening in the yield curve – that is, investors are demanding a greater premium for holding longer term debt relative to shorter term debt.
A steeper yield curve increases the financing cost of longer term projects for businesses and also mortgage rates for consumers, as they are typically priced off of long term debt and cannot be ported when moving house. It also increases refinancing risk should businesses finance long term projects by rolling over short term debt.
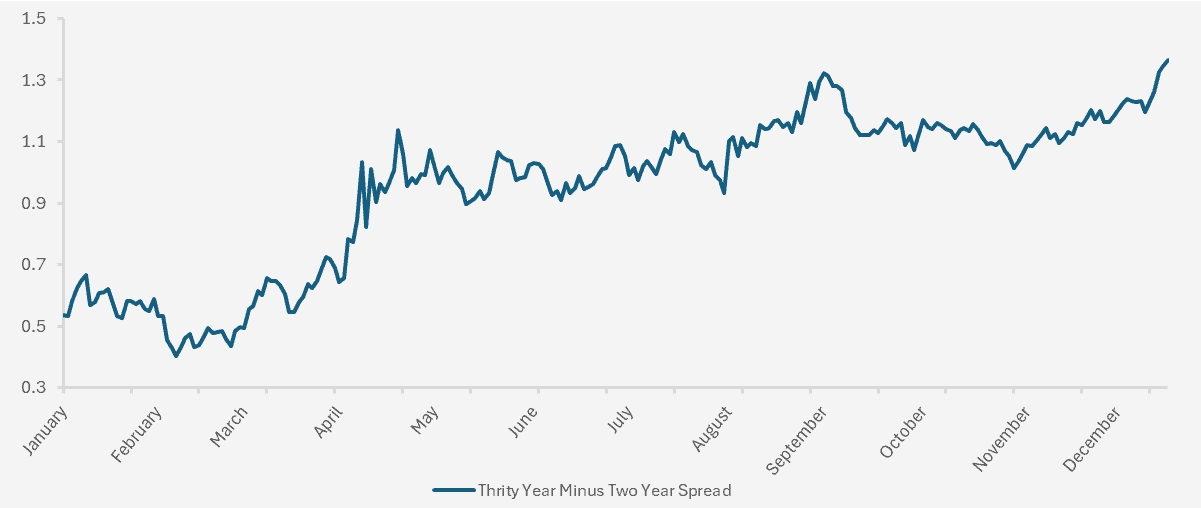
Chart showing the difference in yield (spread) between thirty year and two year US Treasury bonds. (Source – Watson French with data from Investing.com. Data based on daily opening yields between 02.01.2025 and 16.12.2025. Data correct as at 16.12.2025. When the blue line increases the difference between the two yields is greater, indicating a steeper yield curve).
For the UK investor the US Dollar weakened against the pound by 7.41% (as at 15.12.2025) and this dragged on returns. The US Dollar weakened versus most major currencies, as shown by the US Dollar index declining just over 9% this year (as at 15.12.2025).
Investors called into question whether the US Dollar will continue to be the reserve currency of the world and we did see the US Dollar decline, but it remains within a value range where it is deemed to be fairly valued relative to its fundamentals. Stablecoin issuance picked up as the GENIUS Act created a regulatory framework for the technology and this is expected to be supportive for US government debt flows, but it does bring potential risks.
Despite all of this financial conditions remain strong and equities have continued to post positive returns. Corporate bond spreads are extremely tight (see chart below) and the yield on government and corporate bonds looks more attractive than it has done in a long time.
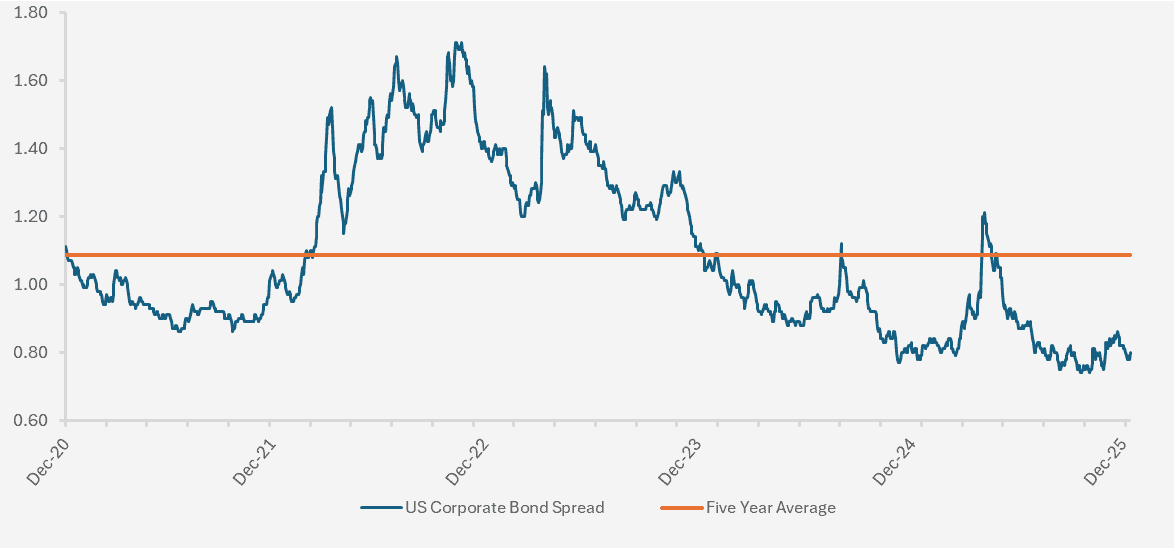
Chart showing ICE BofA US Corporate Index Option-Adjusted Spread over a five year period from 12/12/2020 – 12/12/2025.. (Source – Watson French with data from St Louis Fred & ICE BOFA Indices. Data based on daily data points. Data correct as at 26.11.2025. The blue line shows the difference between the yield on US investment grade corporate bonds and a spot treasury curve. The orange line shows the historical average over the five year period. The lower the line the tighter the spread the less compensation a bond hold receives for the credit risk involved in investing in corporate bonds. Put another way the lower the line the more expensive corporate bonds are).
As AI related companies issue more debt we will see the potential for corporate spreads to widen slightly as supply better matches the demand for corporate bonds.
–
UK
The FTSE 100 reached an all-time high at the start of December, but unlike the US we saw no real structural drivers behind this. The main winners in the UK were financial companies, defence companies and precious metal miners. We see the UK market as income-focused and perhaps more cyclical than the US.
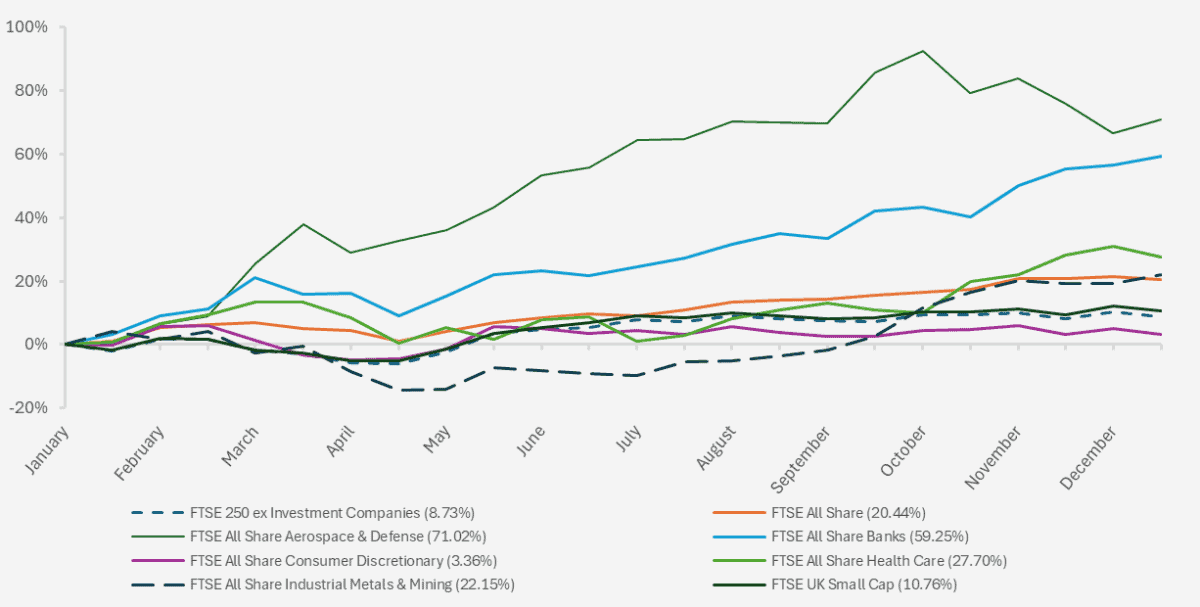
Chart showing YTD performance of various UK equity indices and sub-indices (Source – Watson French with data from FE Analytics. Returns in pounds sterling. Data based on bi-weekly returns. Data correct as at 15.12.2025).
Financial companies net interest income margins remain strong with interest rates higher and defaults remaining low. We saw the Bank of England lower interest rates from 4.75% to 4.00%, representing three 0.25% cuts. Expectations for a further cut in December are high but for 2026 cuts are expected to be minimal and market pricing presently shows two cuts. These are all tailwinds for the banking sector in addition to the prospect of deregulation, will help further.
Banks also dodged any tax rises at the Autumn Budget which in the long run will help the UK as a financial centre. Defence companies did particularly well, with the UK and other major economies looking to increase their defence spending as a share of GDP. The prospect of peace in Ukraine leant somewhat on the momentum of these companies but as conflict picks up in the world the need for defence remains important and so their share prices will likely remain elevated.
Mining companies in the precious metals sector performed well as the prices of gold and silver moved higher. This has not been included on the chart below as the return of 210.25% skewed the scale of the chart. Industrial mining companies fared comparatively worse.
We continued to see an outflow of companies from the UK with the biggest hit coming from AstraZeneca, the biggest company in the UK, opting to list its main share in the US and use depositary receipts for trading in the UK. The biggest IPO in the UK came from the challenger bank Shawbrook, which was initially valued at £1.92 billion.
Smaller companies continued to struggle throughout the year as the higher interest rates environment, US tariffs and increases to minimum wage and National Insurance Contributions weighed on their earnings.
Overall the equity market produced strong returns, leading the FTSE 100 to its all-time high without too much of a structural driver behind the returns. The weakening US Dollar weighed on FTSE 100 earnings as these companies generate much of their revenue in US Dollars, but this didn’t impact the share price rise too much. The UK offers a source of diversification away from growth-focused technology companies with attractive income on offer, which has generally been less volatile than share price performance. Historically dividends have accounted for 75% of UK equity returns, whereas they only account for 37% in the US.
We saw two main themes driving the UK this year; the Autumn Budget and speculation around it, and economic growth.
The Autumn Budget proved to disappoint many and had the effect of increasing labour market problems and stalling economic growth, as businesses held off investment and hiring in anticipation of relentless speculation over tax and legislation changes. Spending was front loaded and tax rises pushed back. The government’s fiscal headroom increased from £9.9 billion to £21.7 billion and this kept bond markets relatively calm. The risk is that these tax rises do not materialise (as they fall near an election year) or that the fiscal situation deteriorates further.
Economic growth remained sluggish throughout the year and inflation remained elevated relative to other developed countries. CPI started the year at 3.0% and the latest reading for November put the figure at 3.2%. This is still materially higher than the Bank of England’s 2% inflation target and has put pressure on interest rates to stay higher. The problem has been that alongside higher inflation caused by minimum wage and National Insurance increases, economic growth has been poor. Third quarter estimates for GDP growth were just 0.1%, a decline from 0.3% in the second quarter and 0.7% in the first quarter. Unemployment has also picked up from 4.4% in January to 5.1% as of October.
Like other major economies, UK government debt has also been picking up and interest costs on this debt are accounting for a large proportion of government spending. Higher interest rates only make this problem worse.
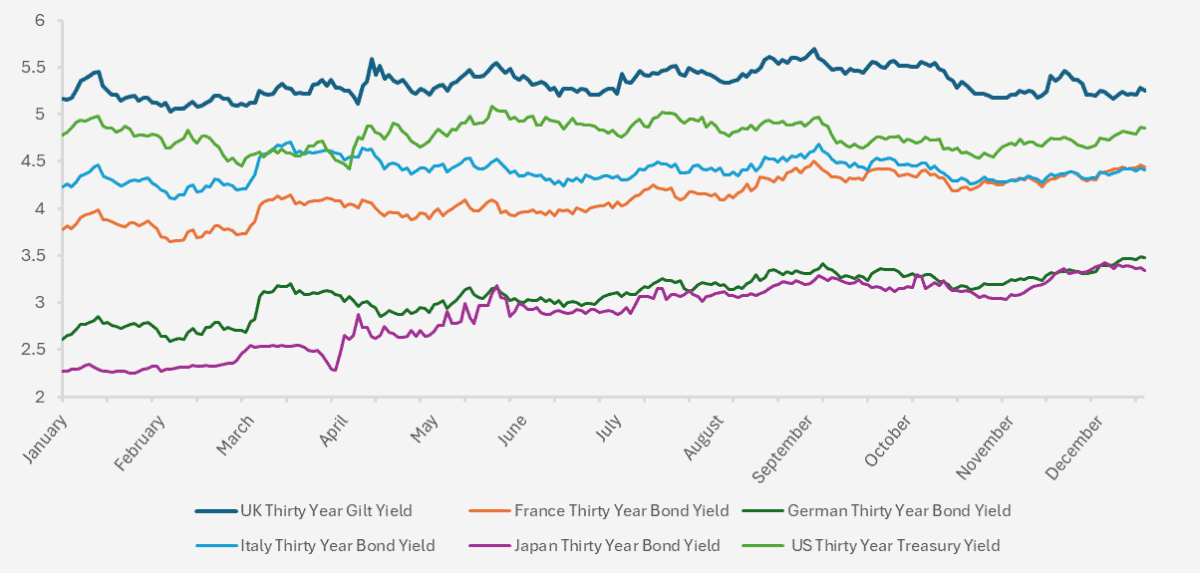
Chart showing the yield on 30 year government debt from various developed countries between 02.01.2025 to 15.12.2025. (Source – Watson French with data from Investing.com. Yields based on daily opening yields. Data correct as at 15.12.2025).
We can see in the chart above that the yield on long term UK government debt is higher than most major developed economies and has stayed so throughout the year. Part of this is due to debt management of the UK, where the Treasury has preferred to issue longer dated debt, including a higher proportion of inflation-linked debt. It also shows that investors are concerned with the debt and economic dynamics of the UK. In 2022, Liz Truss memorably pushed up bond yields with her unfunded spending plans and this has changed investors’ perceptions of the UK. The Bank of England stated it will start to buy up more debt at the long end of the yield curve and the Treasury will issue less longer dated debt, which could help to bring the yield down.
In the UK demand for the longer end was driven by defined benefit pension schemes and insurers. With more pension schemes being purchased by insurers, and also insurers also allocating more to private assets, the demand for these bonds has fallen. One sign of higher long term bond yields is the expectation for higher economic growth, but in the UK this seems unlikely and the most plausible explanation is the fiscal health of the economy.
–
Robert Dougherty, Investment Director
December 2025
This article is not a recommendation to invest and should not be construed as advice. The value of an investment can go down as well as up, and you may get less back than you invested. Data is correct at time of writing and cannot be guaranteed.