1st April 2026
The logistically important Strait of Hormuz has been closed for over a month, pushing the prices of natural gas, oil and many other commodities such as fertiliser higher. Global financial markets have been falling and inflation has come back to the fore.
Most major central banks met in March to vote on their interest rate policies. When we see an energy supply shock, the standard view for central banks is to look through it, as the increase to the cost of energy and the resulting impact on inflation should be offset by a fall in economic growth.
Interest rates won’t make more oil appear but can be used to manage inflation expectations. This is dependent on the length and magnitude of the shock however – markets may be getting flashbacks to 2022 when the war in Ukraine drove energy prices up, but as the starting position on bond yields, inflation and employment is different, we don’t see markets moving in exactly the same way as before.
Of the major central banks, the US Federal Reserve opted to hold rates and surprisingly quoted tariffs in their statement. The European Central Bank opted to hold rates again for the eighth time in a row. The Bank of England made a bit of a mess of their communications, opting to hold rates but cautioned that there may be rate increases.
There are two important outcomes from central bank meetings – what they do, and what they say. The arguably more important point is what they say and the guidance they give. The Bank of England Governor Andrew Bailey fell short on this, as evidenced by markets expectations switching from three rate cuts in the UK this year to potentially four rate increases. We think this is unlikely and market pricing is currently too high.
Global equity markets declined in March. US equities fell by less than many other global equity markets, but because of their poor start to the year they still remain the biggest underperformer. The US is an energy exporter and so is more insulated from overseas energy shocks, but it isn’t immune. Emerging markets had been performing very strongly, but as many countries in Asia rely heavily on energy imports, they have seen big declines in their performance.
Government bond yields have risen over the past month with greater pressure on short term yields, as markets price higher shorter term inflation. Government bonds usually increase in value in times of market distress but as markets are focusing on the inflation impact and not the growth impact, yields have risen rather than fallen.
We think the increase in bond yields partly reflects increased energy prices but also markets’ view that governments will need to increase defence spending, as global conflicts become more frequent and national security becomes more important. Bond yields include a greater term premium (the premium investors demand to hold longer dated bonds) to compensate for higher volatility in yields than we have been used to.
Investors also had positions in “steepener” trades which they have had to unwind. A steepener trade means markets expect short term yields to fall more than long term yields (from rate cuts) and hence the yield curve steepens. Markets buy short term bonds and sell longer term bonds to profit from these moves. Recent moves upwards in short term bonds had put pressure on this trade and will have forced some investors to sell out of their positions. We see this as putting additional upwards pressure on yields – it is like everyone on a small boat suddenly running from one side of the boat to the other.
Private credit has also dominated the headlines, with increasing news flows highlighting the risks of the software exposure and illiquidity of the sector. This spilled over into the public markets, with banking stocks declining as their exposure to the industry becomes more apparent.
Finally, we wouldn’t be content without having a dig at gold (pun intended!). Gold’s role as a risk mitigator and a safe haven asset has been called into question. Over the past month we have seen more evidence that gold is a momentum play and not a hedge against inflation or political risk. When equities have fallen because of the Iran conflict, we have seen gold move in tandem. When news improved and the supply of oil and other commodities looked to be improving, equities rose and so did gold. Gold is traded in US Dollars and as the US Dollar strengthens, this weakens the price of gold (the US Dollar index has strengthened by nearly 3% in the last month).
Longer term government bond yields have been rising despite long term inflation expectations remaining fairly anchored. This means that markets expect long term real rates to be higher, which isn’t good for gold as it doesn’t pay out a regular income. We think gold’s movements point to it being a risk asset, trading in a speculative price range.
–
Areas of focus
- Global government bond yields have risen as investors are more concerned about inflation rather than the impact on growth. Yield curves have moved from steepening to becoming flatter, causing an unwind of the steepener trade.
- Corporate bonds spreads have widened but only marginally, protecting returns better than government bonds and supporting the “inflation not growth” impacts investors are focused on.
- Energy stocks have outperformed other sectors on short term energy price rises. Longer-term returns depend on the longer-term outlook for prices.
- Banking stocks have declined. One explanation is the link with private credit. Another is that they were overvalued coming into the year.
- The price of silver plummeted in March, falling over 24%.
- Global emerging market equities have seen a pullback in performance as they are largely energy importers. They remain positive for the year still and longer term structural changes still make them attractive.
- European equities have fallen in line with US and UK equities. Like the UK, Europe is reliant on importing energy from overseas.
–
Asset Class Returns
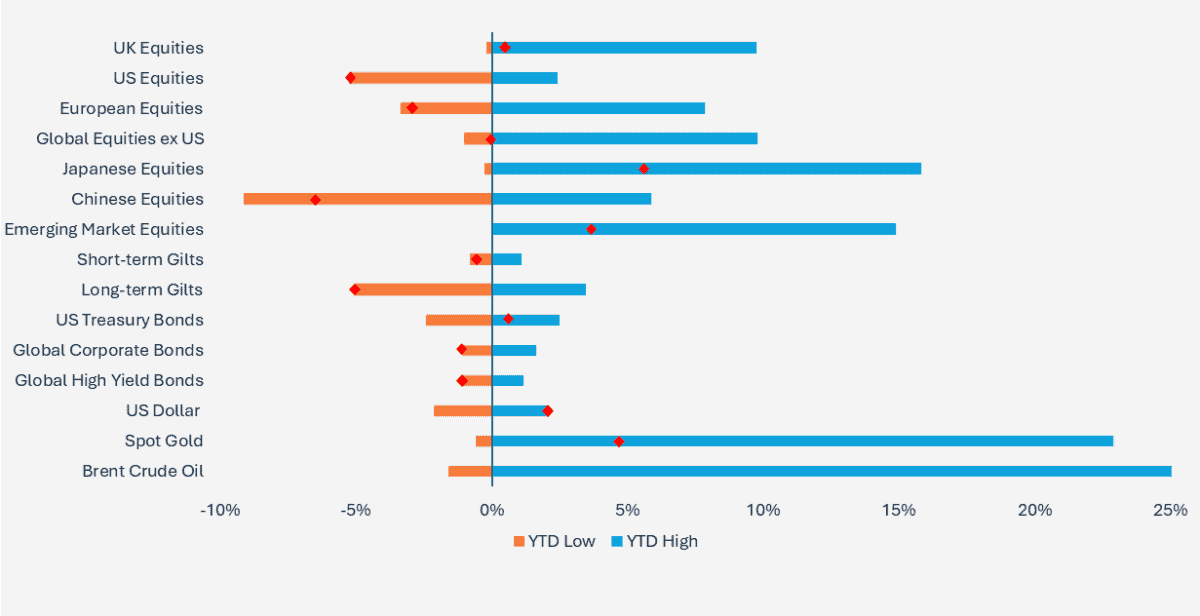
Selection of assets 2026 YTD returns and range of returns as at 29.03.2026 (the two ends of the bars represent the range of YTD returns and the red dots represent the current YTD return). Indexes used: FTSE All-Share, Russell 3000, STOXX Europe 600, MSCI World ex USA, MSCI Japan, MSCI China, MSCI Emerging Markets, FTSE UK Conventional Up To 5 Years, FTSE UK Conventional Over 15 Years, ICE BOFA US Treasury, ICE BOFA Global Corporate Hedged GBP, ICE BOFA Global High Yield Hedged GBP, US Dollar Index, S&P GSCI Gold Spot & S&P GSCI Brent Crude Spot. Returns hedged back to GBP with exception of US Dollar which is in US Dollar terms. Returns based on daily data. Source – Watson French with data from FE Analytics and MarketWatch. Data correct as at 29.03.2026). The YTD point for Brent Crude Oil is not shown as its YTD return is 87.82% and including this would distort the chart too much.
–
Private Credit
Last month we started to discuss our concerns over the state of the private credit market and with more and more news flow, we feel it is important to continue this discussion.
The management teams and CEOs of private credit firms seem puzzled by the headlines of the high risks and increased stresses in the sector. They know they sector better than anyone else and reiterate that loans are in fine shape with contained default rates. I would point out that they are paid to say this, and it is in their own self-interest to mislead calm markets.
Private credit is an opaque and highly information-asymmetric sector, and at its core it involves issuing loans to private equity companies to buy unlisted companies. It is a $2 trillion market and has grown substantially since the 2008 Global Financial Crisis (GFC). Returns on private credit have been higher to compensate investors for the lack of liquidity; that is, because private assets and funds cannot be easily nor quickly bought and sold. Loans in private credit also tend to be to higher risk and less financially stable companies.
As of relatively recently, investors have become more and more concerned about the illiquidity of the sector and what the actual risks and underlying exposures are.
This kicked off due to several factors: investors taking account of the growth of private credit and the drive to sell this to retail investors, the pickup in interest rates and a higher yielding environment, Anthropic releasing tools that could potentially replace software companies and the increase in fraudulent activity in private debt markets. In our view we see large risks developing in the system and in the future, could see this impact the wider system should leverage build and defaults pick up.
While we focus on the risks here, it is important to note that private credit is a useful and important asset class and has expanded the range of businesses that can access financing since the GFC, and in turn this has driven economic growth. I would also note that private credit has many different investment structures (publicly traded and privately) and we talk broadly about them here.
Private credit and Business Development Companies (publicly listed investment vehicles that issue private credit) pay a higher yield relative to publicly-traded debt. At the same time, the default or loss rate on their loans is claimed to be lower. This doesn’t make sense in our view – higher yields equate to higher risk, and so higher default rates. Private credit companies state that the extra yield comes because they are better at underwriting more complex credit, and from the flexibility they offer (the loan terms do not have to be standardised, unlike public debt). We disagree with this.
In markets everything is priced according to its risk and there is no free lunch. We suspect the credit risk or leverage involved is actually much higher than what is reported and that this is driving the higher yield. We also note that in public markets, if a company cannot pay its coupon (interest) this is considered a default. In the private credit sector, companies can opt for payments in kind if they cannot pay. This is essentially a default, but instead in private credit it means the company will add the interest to the principal they have to repay at maturity instead and pay it then.
I would also note that if you were to look at the underlying companies in a private credit fund, you would be hard pressed to recognise any of them. They are often very small businesses and start-ups, such as new technology companies, small car washes and veterinary practices for example.
Unlike publicly traded corporate bonds, private credit firms issue loans which tend to have floating interest rates that move up and down with market rates. Many of these loans were issued in a low interest rate environment and with interest rates now higher and expected to remain so, the pressure is building on companies to meet repayments. A large volume of these loans have been made to software companies who have had a tough start to the year over fears of AI displacement.
We note that in the US leveraged loan sector, the yield on loans to software companies is at 12%, having risen from 9.5% at the start of the year. The wider sector yield is just above 8.5%, rising from 8% at the start of the year.
Private credit funds are described as “semi-liquid” as they generally allow up to 5% of the fund’s value to be redeemed each quarter. An asset is either liquid or it isn’t, there isn’t an in-between. As soon as a private credit fund is gated (i.e. it limits redemptions) it creates a self-fulfilling prophecy. Even if there is nothing wrong in the fund, if it limits redemptions investors are going to want their money back and this will exacerbate the problem. We then see the funds start to find dangerous ways to pay this money out to ease the pressure e.g. taking out loans.
Governments and regulators are increasingly looking to expand access to private credit so it can be bought and sold by retail investors. In April for example, the UK will allow investors to hold private asset funds in their investment accounts. There are many problems with this course of action, but the main issues are information asymmetry, understanding the risks and liquidity.
Private assets by their very definition are opaque and specialist knowledge and experience is needed to analyse the underlying holdings. Big institutions find it hard enough to do this and so how the retail investor can be expected to do so is puzzling (the information just isn’t there). This creates an information asymmetry, where one party benefits and the other doesn’t. This is exactly why trading on inside information in markets is illegal.
We take liquidity in markets for granted, buying and selling shares often within seconds, but illiquidity in private markets is real and despite the risk warnings alongside investment in these assets, we do not think it will be sufficient – think of Neil Woodford and the collapse of his fund due to bad investments in illiquid assets. Is reading a document which states that buying and selling an investment is restricted enough protection for retail investors?
Institutional investors have held onto these private assets and funds for many years and have generated strong returns. With market valuations high and risks increasing they are looking to offload their holdings and lock in their returns. We see this through the use of continuation vehicles (a private credit fund selling its holdings into a new fund to release capital for investors looking to exit). Allowing the retail investor to invest in these funds provides institutional investors with a buyer but leaves the retail investor holding the risk and the potential losses at a time when the risk is highest. We have seen this before with the use of Special Purpose Acquisition Companies (SPACs), where the initial investors generate good returns and the later investors are left holding the junk.
We have recently seen private credit company share prices plummet, redemption requests pick up (of which an increasing amount are not being met) and BDCs trading below their net asset values. The broad index of BDCs is trading at 82% of their value at the start of the month, relative to 100% at the end of last year.
We always see looser underwriting standards in the late cycle of an asset class. If we look back at TriColor and First Brands defaults, many big managers were caught off guard but proper due diligence would have shown a myriad of warning signs. Issuers and managers are also “shopping around” credit rating agencies to get the best rating to rubber stamp a loan.
While the bad loans and redemptions may be stemming from several BDCs and not the whole market, as Jamie Dimon, CEO of JP Morgan said ‘when you see one cockroach, there are probably more’.
Last month we saw a UK lender specialising in bridging loans collapse following allegations of fraud. Creditors are claiming a shortfall of £1.3 billion. The concern is that from recent reports in the Financial Times, the fraud seemed obvious with clear warning signs. But major players in the lending market such as Barclays were happy to provide financing to the company. Again, we think this is akin to later market activity where lenders and investors are fearful of missing out and so ignore the risks, and underwriting standards reduce.
Finally, one myth to dispel is that private credit (and private assets in general) are less volatile than public markets. This is inherently not true. Public assets are valued whenever they are traded, which means daily pricing. If a conflict starts, the assets will be priced daily throughout. Private assets are often only valued when they actually change hands. This is not daily, and so assets can go for long spells without an updated market price. Firms may estimate their value on a quarterly basis to meet redemptions but they are not valued regularly. They may not be valued at the start of a short drawdown but at the end, making it look like the asset had no volatility – the frequency of the pricing makes it look like the volatility is low, but in fact it is just hidden or not reported.
Private credit matters because any risk of downturns can spill over into the wider market. Banks in the GFC were under collateralised and were using their own poorly-funded reserves to make risky investments. Private credit firms, on the other hand use money from investors and don’t have any depositors.
But major banks do lend to private credit companies, providing them with leverage and rolling credit facilities. Private credit funds also invest in each other, magnifying the counterparty risk at both the first and second order connections (i.e. I may not be invested in private credit but my bank is, so this can spill over to affect me). Banks have also used tools caused “synthetic risk transfers”, which effectively transfer the credit risk to another party. There are concerns regarding who this risk is actually being transferred to, and whether it is just to another part of the same bank. Some reports even question whether risk is being transferred from the ring-fenced investment banking arm of a bank to its retail banking arm.
Private credit has been responsible for the majority of the growth in lending in the US since the GFC, and so if it is cut off or deemed too risky it could drag down wider economic growth. If investors see material risk in one part of the market they may sell off assets in other parts to protect their capital. Many major life insurance and pension funds have invested a large portion of their assets in private credit. Downturns will impact the liquidity and returns of these funds, which do have direct obligations to the retail consumer and investor.
The issue is we cannot see what is going on underneath the surface. It is only in a downturn that these risks become apparent. What we do know is that throughout history, we have seen bubbles and market crashes and they often stem from excessive risk taking and lack of risk management. So we are wary of the development that we are seeing in private credit.
–
US
The US labour market lost 92,000 jobs in February, falling far below the 55,000 new jobs economists had forecast. The unemployment rate pushed up to 4.4%, reversing its decline in January. We pointed out last month that that jobs numbers have mostly been revised downwards following their release and we saw this again, with the number of jobs created for January and December being revised down by a total of 69,000.
Absent the oil price increases we have seen this would put more weight behind a rate cut from the Fed. The Federal Reserve Open Market Committee met this month and opted to hold rates as they are. This was expected, as they wait to see what the effect energy prices will have on inflation. The Fed members condensed their views on interest rate moves for the rest of the year with more members seeing no further cuts, consistent with market pricing.
This is unlike the energy price shock in 2022 because the starting place for global economies was very different, having just come out of a pandemic when the supply of goods had been drastically reduced, then needing to be quickly ramped up as consumers spent more. Workers were also able to negotiate for large wage increases and the net effect was to push inflation higher at a time when energy prices had shot up.
Workers have a lot less negotiating room today and we are seeing a weaker and more stagnant labour market. It is important that long term inflation expectations remain anchored. If consumers believe inflation will be higher they are likely to demand wage increases, and if businesses believe inflation will be higher and workers are asking for more money they are more likely to raise their prices. Despite the US being an energy exporter the price of oil is still affected by overseas developments and in particular, oil prices are important for Trump’s approval ratings for the mid-term elections later in the year.
The five-year, five-year forward inflation forecast (what the rate of inflation will average over the next five years, starting in five years’ time) has barely budged in the US, indicating markets don’t think this will have a long-term impact on inflation.
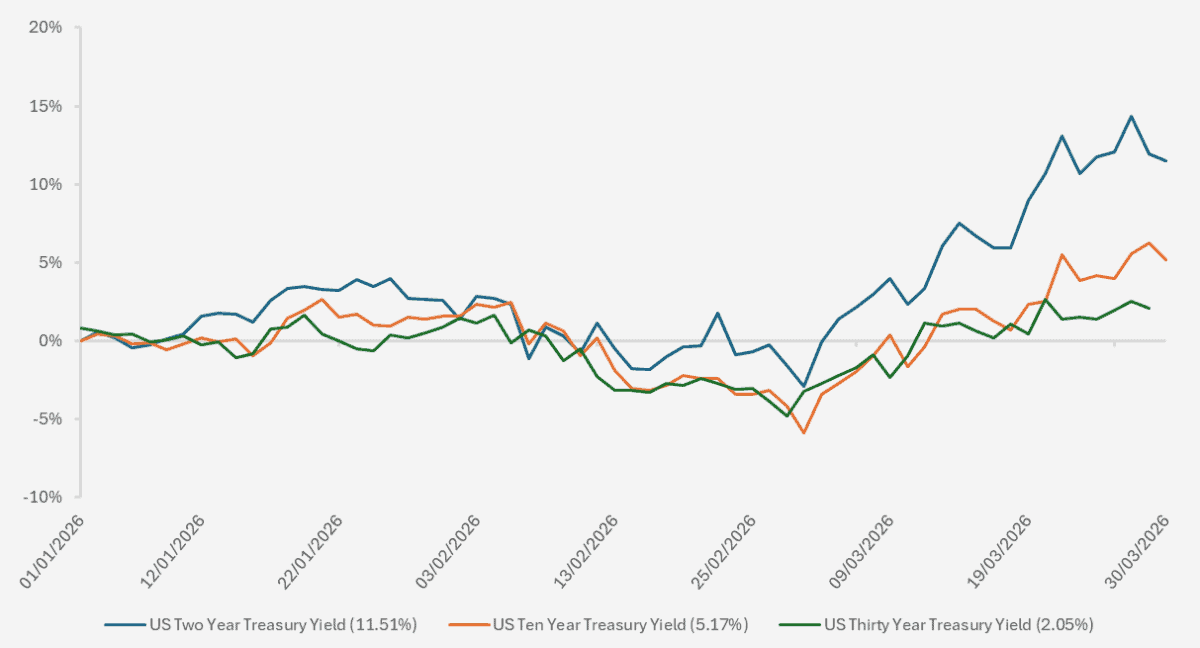
Chart showing the cumulative change in the two, ten and thirty year US Treasury Bonds year to date. Yields in brackets on the legend are the YTD cumulative change. (Source – Watson French with data from Investing.com. Data based on daily opening yields. Data period from 01.01.2026 – 30.03.2026. Data correct as at 30.03.2026).
We can see the market’s thinking reflected in US treasury yields and the yield curve. The bigger increase in the two year yields (which is the most sensitive to changes in the Fed’s policy) indicates that markets expect higher inflation to be shorter term and that short-term interest rates will remain higher rather than rates being cut.
The US High Yield market has also not reacted strongly to the increase in energy prices and other commodities disruption (see chart below). The spread in high yield bonds was already rising before the start of the war in Iran, likely a spillover from the private credit industry, from the increased supply of credit and from concerns over businesses being replaced by AI.
We think there are risks which are not being properly priced in the markets. Many commentators believe US shorter term yields are too high in the current environment and that US ten year yields are higher than they should be, as implied by futures pricing. To us this points to economic slowdowns not being properly priced in. We don’t necessarily mean recessions, just lower economic growth (the US has been growing above trend prior to this conflict) and weaker labour markets.
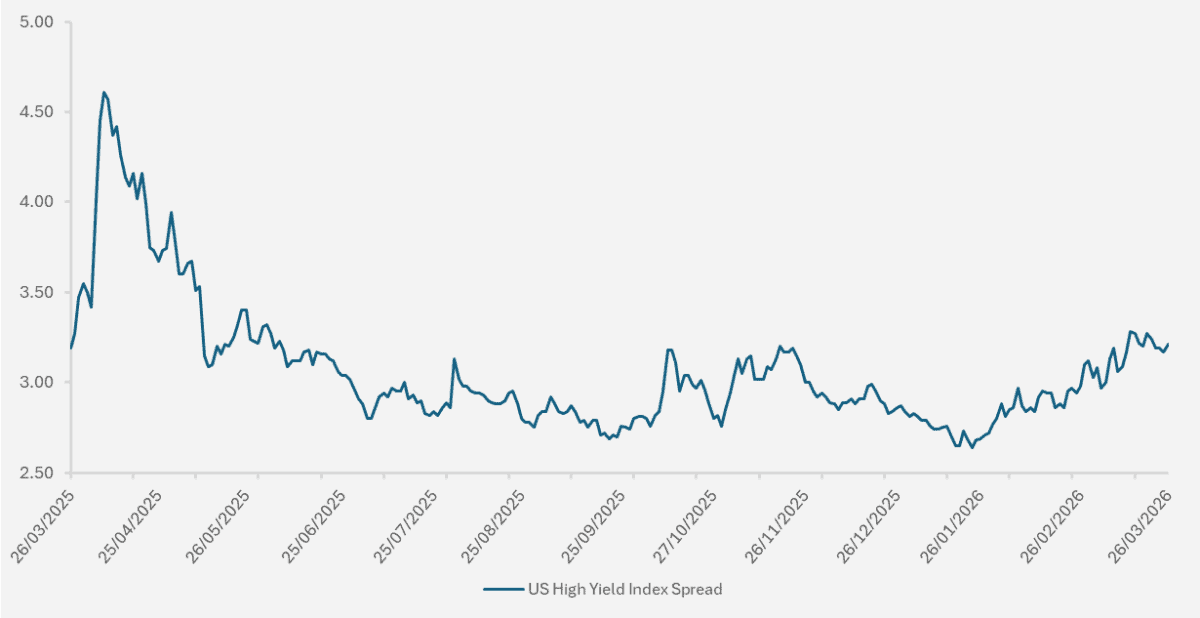
Chart showing the change in the ICE BOFA US High Yield Index Option-Adjusted Spread over a one year period. (Source – Watson French with data from St. Louis Fed and Ice Data Indices. Data period from 26.03.2025 – 26.03.2026. Data correct as at 26.03.2026. The yield spread is the difference between bonds of a given maturity and with a credit rating lower than investment grade, less a spot treasury curve. The higher the spread the greater the difference between the yield on high yield bonds and that of US Treasury bonds i.e. investors are receiving a greater return for a higher risk asset).
In terms of equity market performance, the US has fared no better than any other country. The chart below shows how the equal-weighted version of the S&P 500 index has performed better than the market cap-weighted version, as the concentrated and highly-valued technology companies continue to have outsized influences on the index. Forecasts for the S&P 500 have actually increased since the war in Iran started, with the highest projections forecasting a 3.6% further increase in earnings per share growth. Oil companies’ earnings are expected to grow, but every sector has seen earnings forecasts increase. This includes airlines and chemical companies which are the biggest losers from the increase in energy prices.
Higher expected inflation could cause businesses to increase their prices in order to preserve their earnings, but we find it difficult to see that customers will tolerate more price increases given inflation hasn’t long come down from its recent peaks. AI and efficiency gains could be a factor driving this but again most evidence has pointed to little if no gains so far from implementing AI in their business models.
Memory companies had been seeing huge returns, as demand for memory rocketed as a result of its use in AI infrastructure, but Google recently released a research paper looking at ways to reduce the need for memory and in turn this caused big pullbacks in memory companies’ share prices. These companies are cyclical in their nature and no cycle lasts forever. This could prompt a reduction in their investment to increase supply, and this will keep prices elevated if demand remains constant.
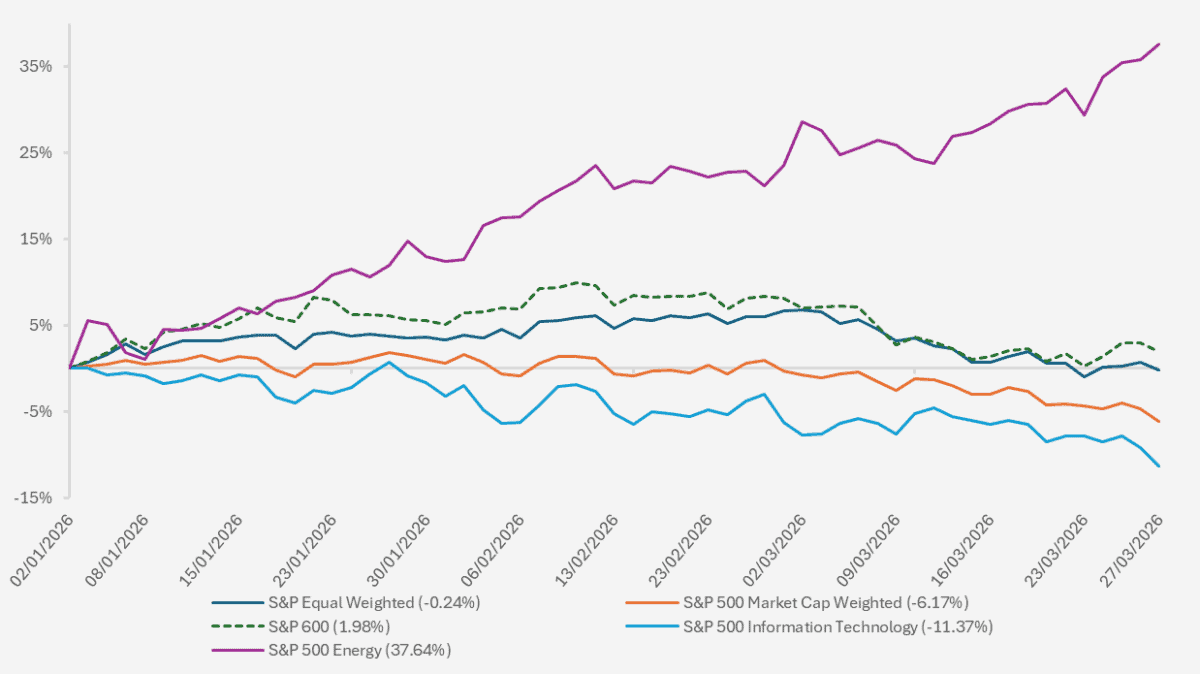
Chart showing the YTD performance of various US equity indices and sector specific indices. (Source – Watson French with data from Investing.com. Data period from 02.01.2026 to 27.03.2026. Data correct as of 27.03.2026. S&P equal weighted index gives all 500 stocks in the index an equal weight whereas the market cap weighted index is based on the biggest companies having more weight in the index. The S&P 600 index is a small cap index).
–
UK
The UK economy failed to grow in January, declining from the 0.1% growth reported in December and below economists’ forecast for 0.2% growth. Combined with higher gas and oil prices and an already above target inflation rate of 3.0%, this puts the Bank of England in a tricky situation and increases the risk of stagflation (no growth and high inflation).
In February, CPI inflation held steady at 3% with services inflation falling slightly from 4.4% in January to 4.3% in February. Core inflation (which ignores food and energy prices) picked up from 3.1% to 3.2%. Markets had previously priced in three interest rate cuts this year but this has now been rapidly inverted, with markets pricing in potentially four rate increases. This is in direct contrast to what some economists think, and consequently they see this pricing as wrong.
We think this number of rate increases is unlikely and would ultimately be a damaging move. The economy is struggling with near zero growth and unemployment is rising. Interest rate increases take around 18 months to have their full effect on the economy, which would be far too late.
Central bank interest rate increases will have no effect on the initial energy price shock. Through their communications they can attempt to stop businesses from raising prices and consumers from bargaining bigger wage increases.
Central Bank textbook response to energy shocks

Oil and gas prices are something businesses and consumers see all the time – it is one of the most public items in the inflation basket. This means that if consumers and businesses see energy prices rising, they will want to offset the effect, and it is these inflation expectations that the Bank of England needs to control and stop from becoming anchored higher. The impact on the UK from the disruption in the Strait of Hormuz has been large because we are an energy importer with a heavy reliance on natural gas. The UK also has a more difficult starting point with inflation and growth in worse positions than the US and Europe.
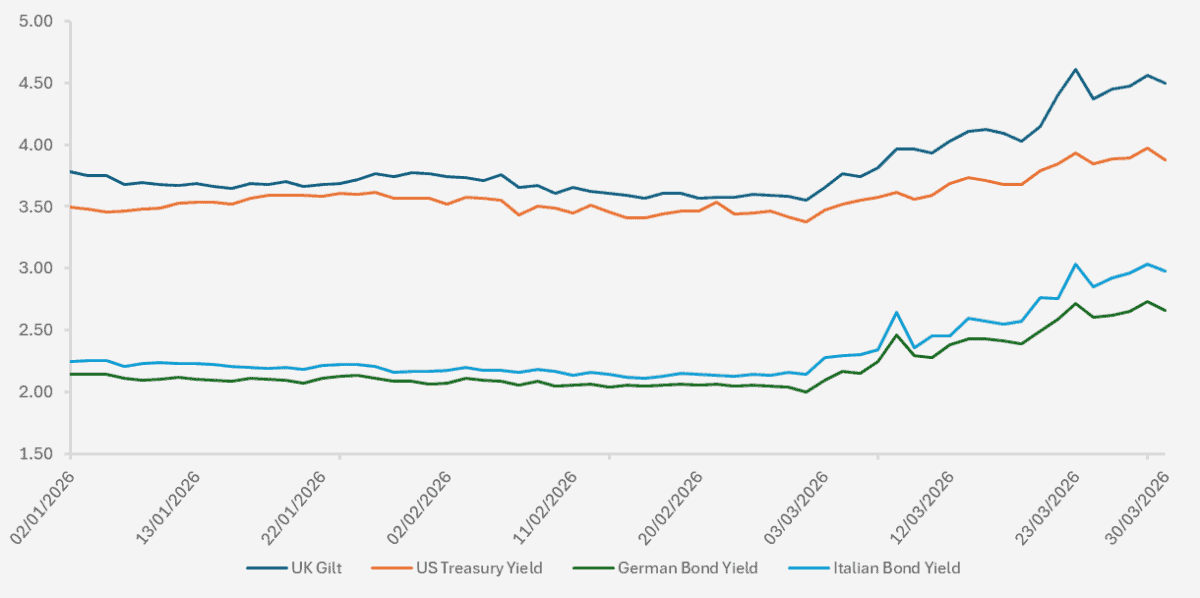
Chart showing the two year yields on the UK, US, German and Italian government bonds. (Source – Watson French with data from Investing.com. Data period from 02.01.2026 to 30.03.2026. Data based on opening yields. Data correct as of 30.03.2026).
UK government bond yields are still elevated relative to other developed economies. There are flashbacks to 2022, with Liz Truss and her disastrous and short lived budget, and investors are still concerned about the UK government’s fiscal policies. Trust is a big factor in bond markets and investors do not trust that the tax increases announced in the 2025 Budget will materialise.
The UK has also been shifting its debt issuance from longer term debt to shorter term, moving more in line with other major developed economies. The issue with this is that refinancing becomes more volatile, as the government has to refinance more often.
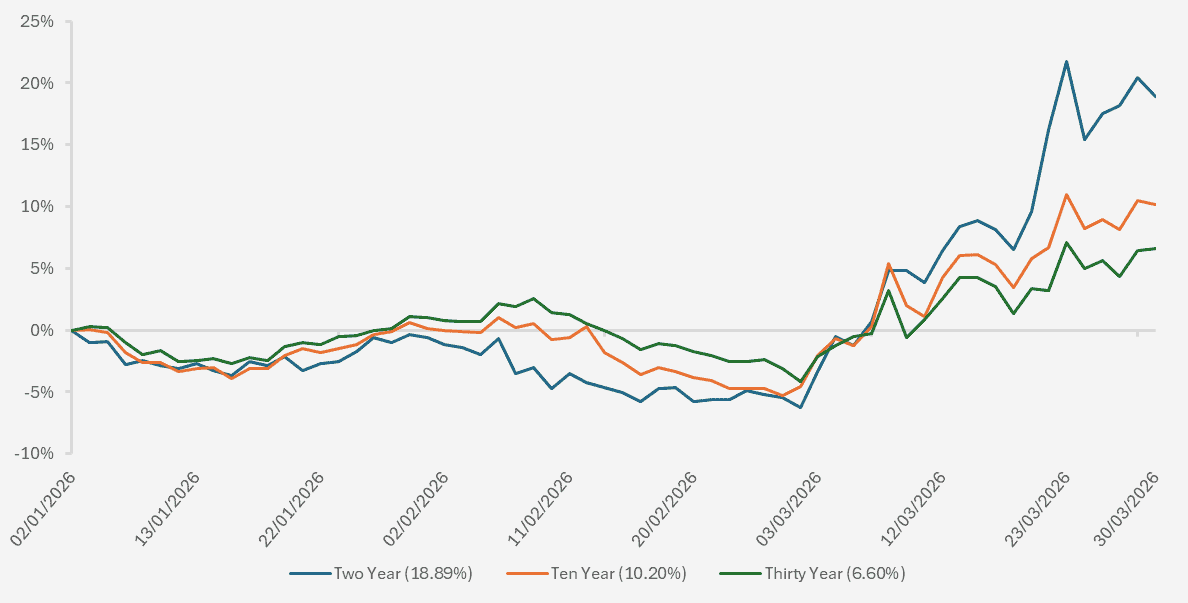
Chart showing the cumulative change in two, ten and thirty year UK gilt yields. (Source – Watson French with data from Investing.com. Data period from 02.01.2026 to 30.03.2026. Data based on opening yields. Data correct as of 30.03.2026. When the line moves upwards the yield is increasing and the price of the bond is decreasing).
Although the rise in the two year gilt yield has been greater than the rise in longer maturity bonds (year to date cumulative change in yields on the two, ten and thirty year bond yields has been 18.89%, 10.20% and 6.60% respectively), two year bonds have still performed better than longer term bonds.
This is because shorter term bonds have a lower interest rate sensitivity (duration), which means when yields change their price doesn’t change as much as the prices on longer term bonds. The average coupon on gilts with a maturity before 2032 is 2.82%. This coupon income helps to offset some of the capital loss from increasing yields. In 2022, yields started at near zero with low coupons and so the protection from increases in yields was thin at best.
This is why we still see government bonds as important holdings in portfolios; they offer good coupon income and low credit risk. If markets see growth slowing, yields will fall as demand for better quality bonds increases. We also don’t see that investors are getting paid enough to take on the interest rate risk with longer term bonds.
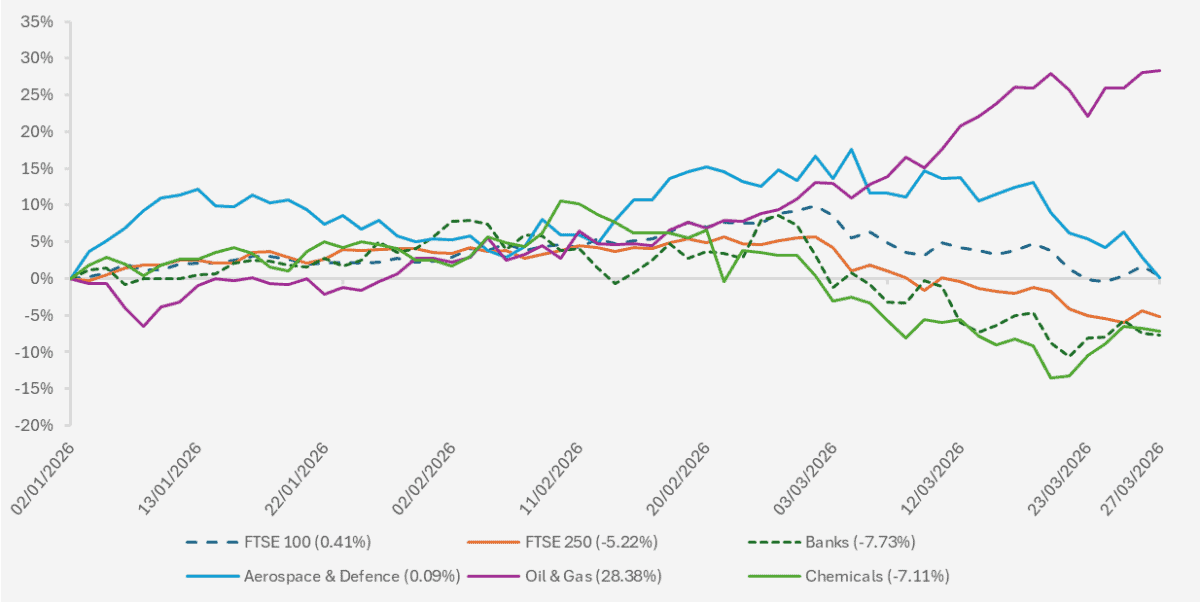
Chart showing the YTD performance of the FTSE 100 and FTSE 250 indices and select FTSE All Share sector indices. (Source – Watson French with data from Investing.com. Data period runs from 02.01.2026 to 27.03.2026. Data correct as of 27.02.2026).
UK bank and chemical stocks have been some of the worst performers this year while energy companies have performed strongly. Aerospace & Defence stocks have declined rather than risen. Usually in times of conflict the potential for defence spending increases, which makes defence companies more attractive. Instead we have actually seen slightly negative performance and again, this follows from markets thinking this will be a shorter-term conflict. As banks have also declined, this points to markets being expensive before the conflict in Iran started and any setbacks such as this will negatively impact these values. The FTSE 100 has performed better than the midcap FTSE 250 index and also smaller companies. This is because the FTSE 100 has more oil and energy companies and larger companies can withstand energy shocks better than smaller companies, especially if interest rates stay higher.
A rising US Dollar will also help larger UK companies as they earn a high percentage of their earnings in US Dollars overseas. We still believe the outlook for larger companies remains better than smaller companies based on the structural changes we are seeing.
–
Robert Dougherty, Investment Director
April 2026
This article is not a recommendation to invest and should not be construed as advice. The value of an investment can go down as well as up, and you may get less back than you invested. Data is correct at time of writing and cannot be guaranteed.