1st August 2026
We knew it was only a matter of time because he just cannot help himself. Trump is jostling for centre stage again with renewed exchanges with Iran and 10-15% tariffs on the rest of the world. Markets have mostly ignored this, with the focus very much on tech spending and interest rates. Markets have a one track mind and don’t like to think about too much at once – the mention of gold and private credit has declined as technology companies come back into focus.
AI spending is contributing a lot to the economic growth in the US, but it is also pushing money into the economy, which is boosting not just stock prices, but also inflation. US CPI in June was 3.5%, still above the Fed’s 2% target (whether this is realistic anymore is debatable). Without AI spending, economic growth could be much lower and inflation could fall. It could however put the US in the same boat as the UK and Europe (sluggish growth and above target inflation). AI spending doesn’t look likely to slow down anytime soon though.
It is earnings season in the US and even with the big technology companies mostly beating growth expectations, they are still being punished as investors are becoming more concerned about the sustainability of this spending. It isn’t about profitability but rather profit durability. In some ways this is good, as it lowers the valuation multiples of the big technology companies and makes them more reasonably priced. But this doesn’t mean the risk has gone away. If there is a risk of a bubble it is a capital expenditure bubble, not a valuation bubble.
Following on from our comments last month regarding the risk of Japanese investors increasing their domestic allocations to equities and bonds and reducing their overseas holdings, the Japanese Finance Minister Satsuki Katayama stated that the government wanted to pursue more investment by Japanese pension funds and households in domestic assets.
While this could be a statement to encourage a stronger Yen, which is continuing to weaken versus the US Dollar, if the policy goes through and Japanese investors start to increase allocations to their own assets it could have big implications for global markets, particularly the US. For example, one party the Finance Minister singled out was the Government Pension Investment Fund which holds $1.8 trillion in assets.
The increased allocation to Japanese assets from institutions is a missing part of the puzzle to shore up the Japanese capital markets. With increased corporate reforms, higher bond yields and companies benefiting from AI spending in Japan, if the government continues to push this agenda we could see demand for US assets fall, and not from a marginal buyer.
We were finally able to talk about the weather in our asset commentary last month and this month a report by the FT highlighted an example of how climate change could become a structural driver of asset returns and economies. The long and prolonged heat wave and lack of rain this summer has wiped out more than 2 billion euros from Europe’s grain crop this year. High and persistent temperatures have greatly reduced farmers’ yields. Europe imports grains when they have poor years of yields and so this will increase demand from grain suppliers such as Ukraine and Brazil.
Wildfires have persisted in Spain and France and the data shows the duration and frequency of them is increasing. If this trend continues, food prices will increase in the long term.
In the UK the big news was political, with Andy Burnham taking his chance to step up to the top role and hoping to last longer than his predecessor. Gilt yields moved up over the month, following in the steps of other major developed economies. This suggests the moves are driven by global movements (oil price increases) not necessarily domestic ones. UK equities have continued to deliver positive returns this month with smaller company returns catching up with larger company returns.
In Europe, the ECB voted to hold interest rates as they are but left the door open to further rate hikes should the war in Iran drag on and energy prices remain higher. With the natural gas reserves in Europe nearly empty and autumn approaching quicker than we may like, later in the year this could push inflation higher as consumers put the heating on.
Emerging market indices have started to come back down to earth, as the sustainability of memory and other AI related companies’ share price growth and future earnings growth looks more and more uncertain. We think these are key reasons why index investing in the region is not an effective way to gain diversified exposure. What started out as a diversifier trade is now just an offshoot of the AI trade.
–
Areas of focus
- Global government bonds yields rose as the war in Iran continued to whipsaw energy prices.
- Technology companies are coming under pressure as they need to prove to investors that their capital expenditures will result in higher future earnings.
- Memory companies continue to be popular with investors despite recent falls in value. A new Chinese memory company listed in China and its share price rocketed over 450%.
- Japanese bond yields continue to move higher, putting risk on capital flowing back into the country from overseas.
- Corporate bond yield spreads remain tight, although they have picked up recently with the ongoing Iran conflict. Further tightening is unlikely and investors are relying on carry to drive returns.
- Emerging market equities continue to deliver positive returns, but there is much divergence in individual countries with AI/tech focused economies performing the best.
–
Asset Class Returns
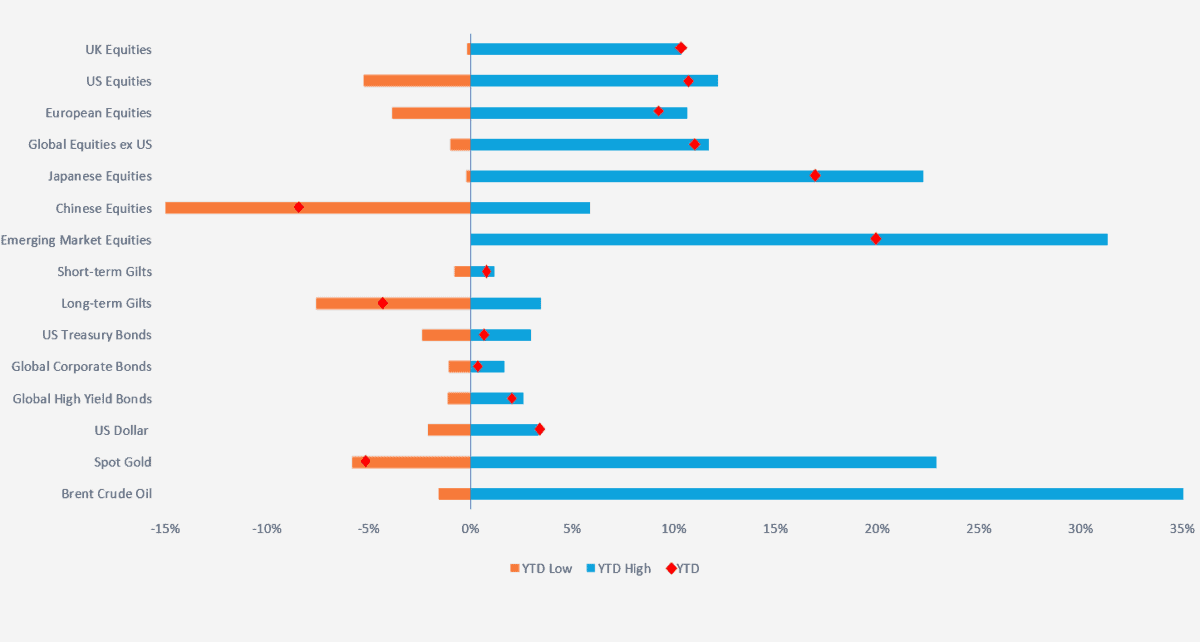
Selection of assets 2026 YTD returns and range of returns as at 27.07.2026 (the two ends of the bars represent the range of YTD returns and the red dots represent the current YTD return). Indexes used: FTSE All-Share, Russell 3000, STOXX Europe 600, MSCI World ex USA, MSCI Japan, MSCI China, MSCI Emerging Markets, FTSE UK Conventional Up To 5 Years, FTSE UK Conventional Over 15 Years, ICE BOFA US Treasury, ICE BOFA Global Corporate Hedged GBP, ICE BOFA Global High Yield Hedged GBP, US Dollar Index, S&P GSCI Gold Spot & S&P GSCI Brent Crude Spot. Returns hedged back to GBP with exception of US Dollar which is in US Dollar terms. Returns based on daily data. Source – Watson French with data from FE Analytics and MarketWatch. Data correct as at 27.06.2026). The YTD point for Brent Crude Oil is not shown as its YTD return is 74.05% and including this would distort the chart too much.
–
US
Since its peak closing price of $211.39 per share just two days after its IPO, the share price of SpaceX has plummeted by over 46%, wiping hundreds of billions off of the net worth of Elon Musk. While SpaceX has clearly struggled under its grand plans for space dominance, hedge funds have been reaping the rewards courtesy of index providers’ desperate bid to include SpaceX into their indices and the large rebalancing of stocks owing to high market volatility and stock dispersion. Indices tend to be rebalanced every quarter and the most recent rebalance required these indices to buy SpaceX. Hedge funds know the indices have to buy SpaceX, and profit from this by buying the stocks that will be joining the indices and selling those that will be leaving the indices in advance. During Q2 over $1.3 trillion in trading flows occurred due to rebalancing according to data from JP Morgan Chase.
One hedge fund made $3.7 billion in a single month which is highly unusual. We expect this to happen again when big listings such as OpenAI and Anthropic IPO and are included in indices and as stock market volatility remains high. It is important to remember that this $3.7 billion in profit isn’t free money magicked up, it comes from someone on the other side of the trade i.e. someone losing money.
Index investing has become so easy and popular but because of the sheer size and volume of trades, much of it has now become mechanical, losing sight of the fundamentals that should be driving markets. We see this as a big risk and prefer the active approach to remain nimble and well diversified.
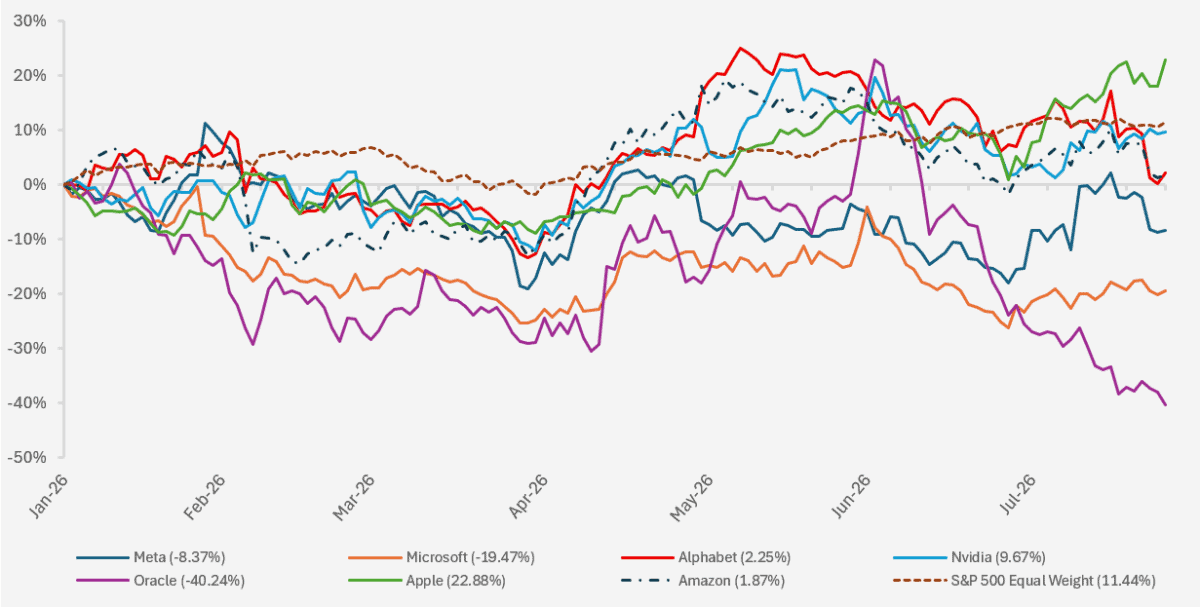
Year to date returns of a selection of US technology related stocks and the S&P 500 equal weighted index. (Source – Watson French with data from Investing.com. Returns based on opening prices and is US Dollars. Data period runs from 02.01.2026 – 27.07.2026. Returns correct as of 28.07.2026).
This month technology and AI dominated investor thinking along with what the Federal Reserve will do with interest rates, as the conflict in Iran had looked to be settling down. The US and Iran reignited the conflict and Trump had the chance to use his favourite word in the dictionary again – tariffs. But it is the technology theme that was most important.
We can see in the chart above how many of the biggest companies have struggled this year, and in some respects this is good to see as it shows the market is paying attention to the most important point – not what companies are spending per se, but whether this will be transformed into an actual increase in earnings. Apple is alone in its strong performance this year as it hasn’t been spending anywhere near as much on AI, instead relying on other technology companies’ AI models to improve its offering. In contrast Alphabet said they will increase capital expenditure this year to $205 billion. At the same time their free cash flow turned negative to -$5.9 billion. While other tech stocks have been selling off, Apple pushed above a $5 trillion market cap, making it the most valuable company in the world. Apple isn’t ignoring AI, it is just not spending anywhere near as much. Part of recent performance and why companies are spending what they are is to do with what these businesses actually do and whether if they don’t develop AI, they themselves will be replaced.
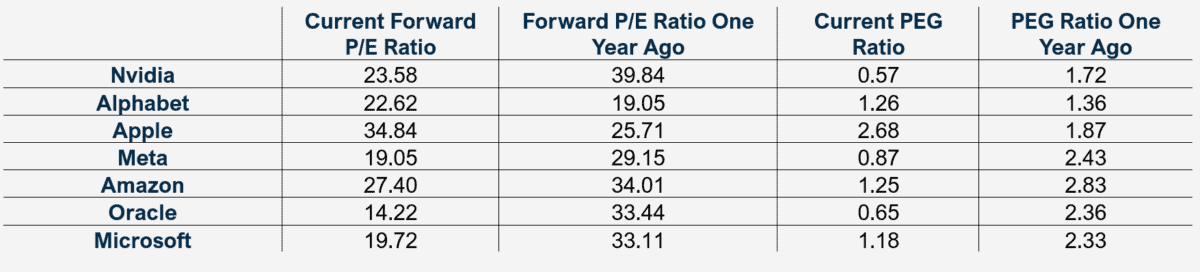
Table showing various valuation metrics of select US technology companies (Source – Yahoo Finance. Data correct as of 28.07.2026). Forward P/E ratio uses a company’s expected earnings over the next twelve months to compare to its current share price. The PEG ratio compares the P/E ratio to a company’s expected earnings growth. A PEG ratio below 1 indicates a company may be undervalued, and a PEG ratio above one may suggest an overvalued company.
The table above shows some valuation metrics over the last year for the big technology companies. Other than for Apple and Alphabet the forward P/E ratio has come down for most companies because the stocks’ multiples have contracted – the earnings growth has improved, but investors are less willing to pay more for this future growth. Relative to past bubbles these valuations are not extreme. In the dotcom bubble we saw P/E ratios well above 100. So as mentioned we see this as a capital expenditure problem – Morgan Stanley now estimates that Google, Microsoft, Amazon, Meta and SpaceX will on average spend a combined $1.1 trillion a year over the next three years on capital expenditure.
The PEG ratios are more reasonable for most of the stocks above (excluding Apple) and they have come down markedly from a year ago. The Shiller CAPE ratio remains historically high, approaching dot com bubble levels. This indicates that investors still believe that the AI growth will keep pace, not track back to historical levels.
We are interested to see whether the retail investor will step in again and buy the dip, a pattern of behaviour which is all too common. We also noted in a previous commentary that the big technology companies are starting to issue shares rather than buy them back. Another effect of this is that the stock options the technology companies offer to their employees to retain talent will increasingly dilute the earnings of the company (more shares means the earnings have to be shared by a greater number of people). Share buybacks previously hid some of this dilution but without these, earnings could become more diluted.
The cost of insuring against default for technology-related companies is increasing as debt issuance picks up. Again this is a capex problem, not a valuation one. It could become both but that would require a big pullback in demand.
The South Korean company SK Hynix, producer of high-bandwidth memory which is crucial for the quick transfer of huge amounts of data for AI applications, completed its placement of American Depositary Receipts (similar to shares but with some different characteristics), raising $26.5 billion. This was the biggest share sale by an overseas company in the US with high investor demand resulting in oversubscriptions of seven times.
Memory companies work in a cyclical industry where demand weakens and grows over cycles. Clearly, with memory prices high investment is needed to build the infrastructure to increase supply, but we are sceptical whether this demand will remain.
While we talk about the big tech companies (Meta, Alphabet, Nvidia etc.) a lot, arguably at more risk of a slowdown in AI demand are the hardware suppliers, energy companies and the myriad industrial companies that have benefited from the big tech companies’ spending. If there is an AI slowdown, the big tech companies still have their other business activities to generate cashflows, but these other companies will quickly lose a chunk of demand. In times of market stress technology companies and industrial companies are highly correlated.
Bond yields have been moving up again recently with inflation still in the picture and the conflict in Iran threatening to push energy prices up again. Investors want rate cuts and lower yields, but as we see in the chart below, compared to the 90s rates are still low. We see rates as normalising from over a decade at extremely low levels and so don’t necessarily expect rates to fall too much.
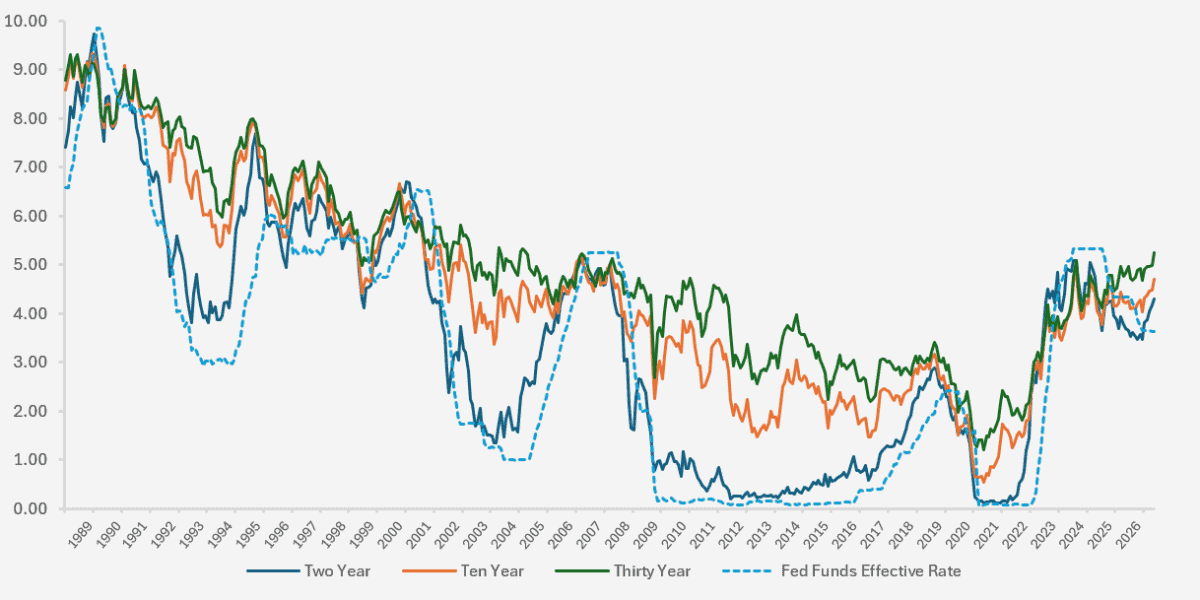
Chart showing the long term yields of the US thirty, ten and two year treasury bonds with the Fed Funds Effective Rate. (Source – Watson French with data from Investing.com. Data period runs from 01.03.1988 – 29.07.2026. Data based on monthly opening yield except from the data point for 29.07.2026 which is based on the closing yield).

The Fed met to vote on interest rates with three members of the Federal Open Market Committee voting for a rate hike, and the other nine members voting to hold rates as they are. Markets still think there will be rate hikes later in the year and doubt whether current rates are enough to pull inflation closer to target, with energy prices still high from the conflict in Iran. The two year yield fell slightly and the longer term yields rose, indicating that inflation will continue to be a problem in the long term. Fed chairman Kevin Warsh didn’t provide an answer as to why they didn’t hike at this meeting and said the rise in bond yields was tightening monetary policy.
We also note an observation from the chart above and that is that the movement in the two year yield often precedes the movement in the Fed funds rate, but lately the two paths have diverged. The Fed funds effective rate has stayed flat/moving downwards while the two year yield has picked up. This reaffirms that the market believes interest rates need to be higher than they currently are. If the market moves the Fed then the Fed’s credibility will be damaged and rates will go higher. It is early doors for the new Fed chairman but he is going to be tested sooner rather than later. At the time of prior to Federal Open Market Committee meeting, there was a 31.5% probability of a 0.25% rate increase as implied by the market. This has now increased to 65.2% for the next meeting in September.
If investors have not priced in normalised rates in their valuation assumptions for equities, we could see further declines in share prices. This matters for smaller companies whose financing costs can represent a greater burden (especially if they are investing in AI to expand/grow or even stay in business) and for the technology companies issuing billions of dollars of debt.
Kevin Warsh’s plan to shrink the Fed balance sheet will also put a floor on bond yields.
–
UK
The big news in the UK this month was political, with Andy Burnham next in line to ‘have a go’ at being Prime Minister. UK bond yields have trended upwards this month but we think this is more of a global influence than a domestic one.
What Burnham will do and how markets will react is anyone’s guess. We think bond yields may be relatively flat on domestic issues because we just don’t see what Burnham can do to move the needle. If he does move the needle via aggressive policy changes then we could see a Liz Truss-style tantrum in bond markets. This will be hedge fund driven as they are price sensitive buyers and provide the main demand for Gilts. But Burnham was committed to meeting the fiscal rules Labour pledged to stick to. The flexibility he wants in using them is where questions are arising.
Other than the political news it has been a fairly boring month in UK markets. Inflation has remained below economists’ forecasts again, coming in at 2.6% in June and down from 2.8% in May, which should give the Bank of England flexibility to leave rates as they are. But with the energy price cap increasing soon this could give inflation a short term boost and prompt the bank to raise rates.
There have been just seven new UK equity IPOs this year, raising £577.2 million with a market capitalisation of £2.2 billion. However, the biggest listing was the Uzbekistan national investment fund at £511 million, not quite the calibre or appeal of, say, SpaceX. In comparison in the US there have been 72 new listings raising $128 billion. So there are clearly more opportunities in the US, but there are some prospects in the pipeline such as software company Visma, which proposed to IPO for $19 billion but later delayed this due to the sluggish performance of the software sector.
But it is the shrinking market which is the problem, as we have spoken about a lot in the past. There were 28 proposed takeovers of larger companies with a value over £100 million so far this year, which would take £59.7 billion out of the market. We still see opportunity in the UK market, certainly from an income perspective, but the opportunity set isn’t getting any bigger. Large structural changes are needed. The London Stock Exchange is set to launch overnight trading next year to cater to the growing retail presence trading after school hours, but this isn’t likely to do much.
–
Emerging Markets & Asia Pacific
Emerging markets have had a good year but there continues to be much dispersion in the regions that make up the index and two broad themes have driven returns higher – energy and technology.
What started as a diversifying trade away from the US has quickly become another way to gain exposure to the AI trade, with the Bank of England now looking at what risks UK prime brokers have in a select number of Asian equities tied to AI. The risk with memory companies like Samsung and SK Hynix is that the parts of their business that have grown their earnings and share prices as of late, are very cyclical (as opposed to structural). They could turn out to be structural but history tells us otherwise with memory.
Samsung’s share price had gained well over 195% over the past year, but it has since dropped by 35% in the past month. SK Hynix’s share price had risen by over 430% over the year, recently falling by 46% in the past month.
The sudden decline has come from several areas. Some of it is because investors used leveraged products to gain exposure to the companies and are now taking profits or deleveraging. A popular way of investing in these memory companies has been through leveraged single stock ETFs. These enhance returns on the upside but magnify returns when the share price is falling and leaves investors exposed to volatility decay (if a share price falls by 50%, it then takes a 100% return to bring the share price back to its original position, not a 50% return).
Investors have been selling technology companies in the US and this will have a knock on effect here as well. A new memory maker in China launched its IPO, increasing competition in memory manufacturing, and another new and low cost AI model was released in China, like DeepSeek, putting doubt into whether all of the memory is actually needed and whether demand will wane.
Even after announcing a 557% increase in operating profit over the last quarter, and sales jumping by 257%, SK Hynix was still punished with a fall of 6% on the day (at one point the share price was down 13%). Markets’ expectations of company earnings is extremely high and perhaps too much was front-loaded into the share price over too short a time horizon. Don’t be fooled by momentum in single stocks, because it can quickly turn. For long term returns structural, not cyclical is key.
We continue to prefer an active approach in Asia Pacific and Emerging Market equities because of the concentration in companies and sectors in the emerging market indices. In the MSCI Emerging Markets index, TSMC, Samsung and SK Hynix account for just over 30% of the index, and technology accounts for 45% of the index. Technology is a key theme going forward but with companies so dependent on one another, investing in a broad index will lead to too much correlation with what is happening in the US.
Another area which is becoming more common in conversations is emerging market debt. Broadly there are two types of emerging market debt. Hard currency debt, which is when the debt is denominated in US Dollars or Euros (more stable currencies), and local currency debt, which is issued in the country’s own local currency. Bonds can be either from governments or corporates (quasi government bonds are also common in emerging markets, as governments can own significant stakes in corporations).
The dynamics and returns of each type of bond are influenced by different factors and so despite seeming very similar, the returns the asset classes actually generate can vary widely (see chart at the end of this section).
Hard currency bonds tend to be less volatile than local currency bonds because they are pegged to a more stable currency. They often trade at a premium to US Treasuries but with less volatility than local currency bonds. The returns are highly influenced by US interest rates.
When US interest rates are higher this can increase the value of the US Dollar. This makes it more expensive for the debt issuer to repay the debt. This is because the domestic government receives their tax receipts in their local currency but must repay the debt in US Dollars. If the US Dollar strengthens, it takes more of their local currency to buy one US Dollar. The effect of this is to increase the credit risk of the debt and so the yield will increase (and the price will fall, as yields and prices move inversely). This is less of an issue for corporate borrowers who may earn revenues in overseas currencies, such as oil producers generating revenue in US Dollars.
So the question is do hard currency Emerging Market bonds look attractive now? In general emerging markets are in much better shape than they have been in the past but as mentioned, it is US interest rates we need to look at here.
With inflation in the US at 3.5%, well above the Fed’s 2% target, there is a possibility of higher US interest rates. The US Dollar index has been strengthening this year and as a longer term structural view, we think developed rates will stay higher for longer and will be more volatile. Many emerging market debts have already raised interest rates over recent inflation and currency concerns but the Fed has still kept rates on hold. This risks the Fed needing to put rates higher later down the line if inflation picks up more than expected. This puts pressure on hard currency yields. But with attractive coupon income this could well make up for any capital losses from yields moving higher.
There are clear diversification benefits with emerging market bonds but the corporate and hard currency emerging market bonds tend to be more correlated with global high yield bonds. The benefit of emerging market debt is the diversified economies they provide exposure to.
High yield spreads in the US are pretty tight and although we have seen a bit of widening lately, the risks are very much on the upside. If high yield spreads widen then so too will hard currency emerging market bonds.
With outside influences also having some effect on bonds (i.e. higher energy prices lowering profits and disposable income and reducing tax receipts) we do see risks in the asset class and so remain wary.
Local currency debt is influenced by local interest rates and inflation, as the debt is denominated in the country’s own currency. This makes them highly volatile and returns can vary widely between countries. But they offer key diversification benefits with other developed market bonds and correlations are often negative or very low (the IA Global Emerging markets Local Currency Sector has a correlation with a broad UK Gilts sector of just 0.19 in Sterling terms).
A key example of local currency bonds domestic influences is Hungarian government bonds, which have returned 11% this year. Driving this return was Viktor Orban losing his seat as prime minister and Péter Magyar taking the reins. Magyar said he will restore law and order to Hungary and work much more closely with the EU.
Emerging markets are in much better shape with improving current accounts and economic fundamentals and generally positive demographic trends. But with inflation volatile and events like the conflict in Iran putting pressure on energy markets, this can quickly deteriorate economic fundamentals and push inflation higher (see our comments in June). We can see in the chart below that local currency bonds have been flat for over 13 years (they are hedged to US Dollars for comparison purposes).
Returns tend to be better when inflation is falling in emerging countries because interest rates will be lower. Each individual country will have its own factors which will influence its local bonds. For example, countries such as Brazil may do better if Europe keeps experiencing heat waves and the destruction of crops, because they are food exporters and demand for their products will increase. Countries such as Saudia Arabia are more influenced by the oil price as they are energy exporters.
As emerging markets improve their economic fundamentals and become more advanced they have been increasingly using their own local markets to issue debt, offering more opportunities.
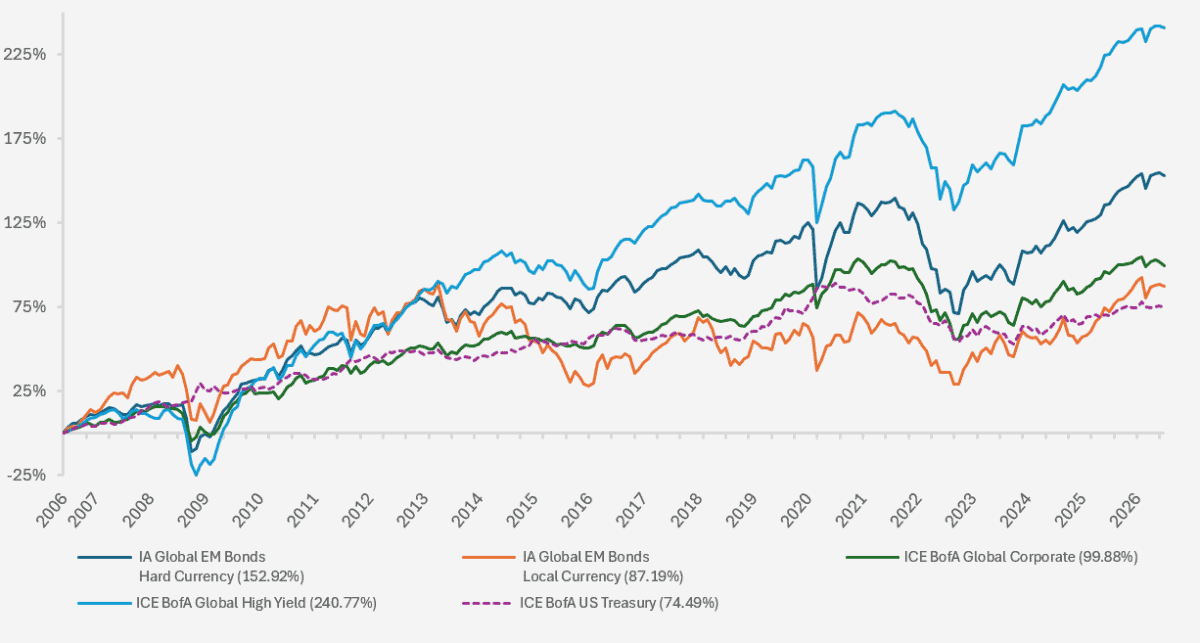
Chart showing the 20 year cumulative returns of emerging market sectors and select bond indices. (Source – Watson French with data from FE Analytics. All returns are in US Dollars and based on monthly total returns. Data period runs from 30.06.2006 – 28.07.2026. Data correct as at 28.07.2026).
–
Robert Dougherty, Investment Director
August 2026
This article is not a recommendation to invest and should not be construed as advice. The value of an investment can go down as well as up, and you may get less back than you invested. Data is correct at time of writing and cannot be guaranteed.